
- Start >
- Rivers >
- Waterlevel >
- Bayern >
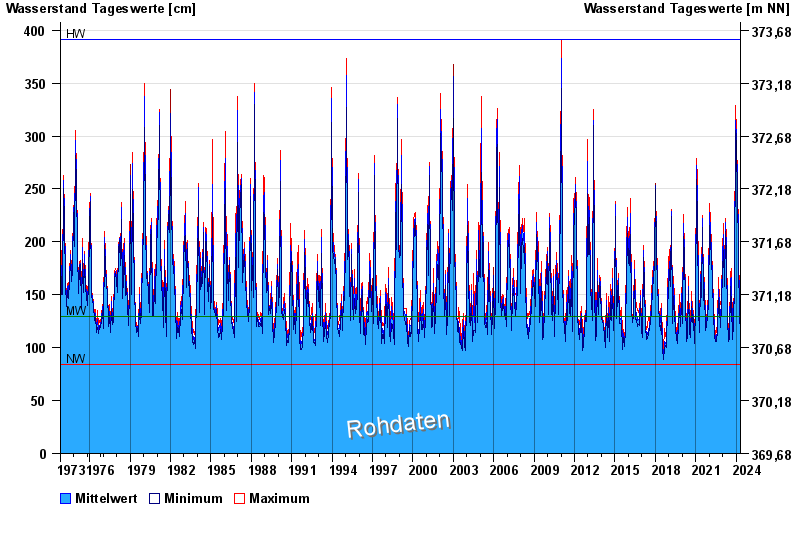
- Unterköblitz >
- Chart of total period

Chart of total period Unterköblitz / Naab
Waterlevel from 01.11.1973 to 29.04.2024
| Date | Mean value [cm] | Maximum [cm] | Minimum [cm] |
|---|---|---|---|
| 29.04.2024 | 121 | 122 | 120 |
| 28.04.2024 | 125 | 127 | 121 |
| 27.04.2024 | 129 | 132 | 127 |
| 26.04.2024 | 134 | 137 | 129 |
| 25.04.2024 | 136 | 140 | 135 |
| 24.04.2024 | 144 | 147 | 140 |
| 23.04.2024 | 150 | 152 | 147 |
© Bayerisches Landesamt für Umwelt 2024