
- Start >
- Rivers >
- Waterlevel >
- Bayern >
- Unterbruck >
- Chart of year

Chart of year Unterbruck / Haidenaab
Waterlevel from 11.12.2025 to 10.12.2026
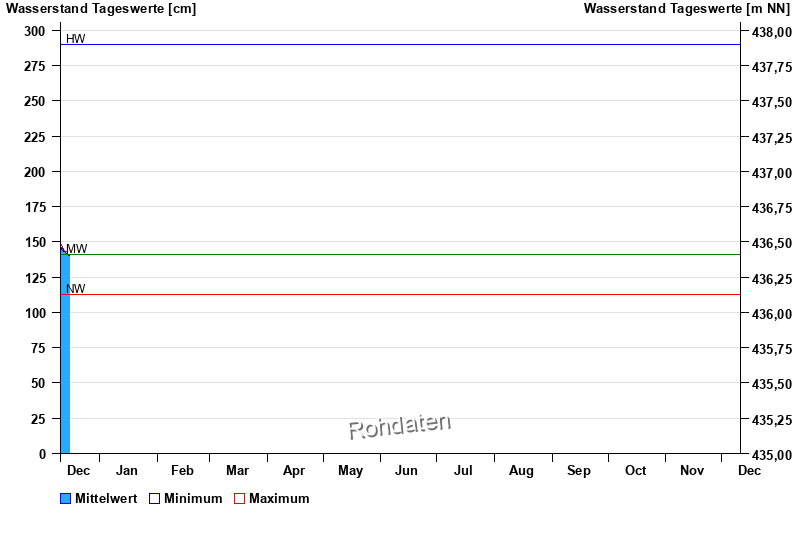
| Date | Mean value [cm] | Maximum [cm] | Minimum [cm] |
|---|---|---|---|
| 16.12.2025 | 141 | 141 | 141 |
| 15.12.2025 | 142 | 142 | 141 |
| 14.12.2025 | 142 | 143 | 142 |
| 13.12.2025 | 143 | 144 | 143 |
| 12.12.2025 | 145 | 146 | 144 |
| 11.12.2025 | 147 | 149 | 146 |
© Bayerisches Landesamt für Umwelt 2025