
- Start >
- Rivers >
- Waterlevel >
- Bayern >
- Unterbruck >
- Chart of year

Chart of year Unterbruck / Haidenaab
Waterlevel from 01.01.2024 to 31.12.2024
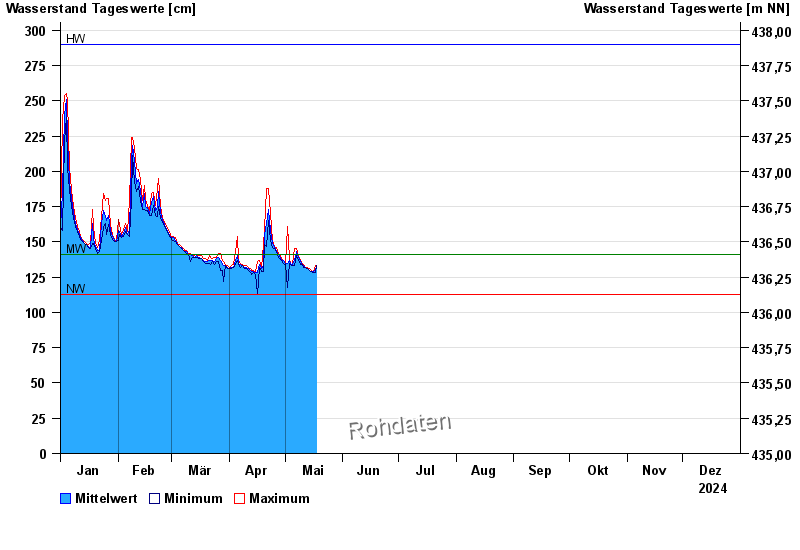
| Date | Mean value [cm] | Maximum [cm] | Minimum [cm] |
|---|---|---|---|
| 27.07.2024 | 126 | 126 | 126 |
| 26.07.2024 | 126 | 126 | 125 |
| 25.07.2024 | 126 | 127 | 126 |
| 24.07.2024 | 127 | 128 | 127 |
| 23.07.2024 | 128 | 128 | 127 |
| 22.07.2024 | 130 | 131 | 128 |
| 21.07.2024 | 128 | 129 | 128 |
© Bayerisches Landesamt für Umwelt 2024