
- Start >
- Rivers >
- Waterlevel >
- Bayern >
- Unterbruck >
- Chart of year

Chart of year Unterbruck / Haidenaab
Waterlevel from 09.02.2024 to 08.02.2025
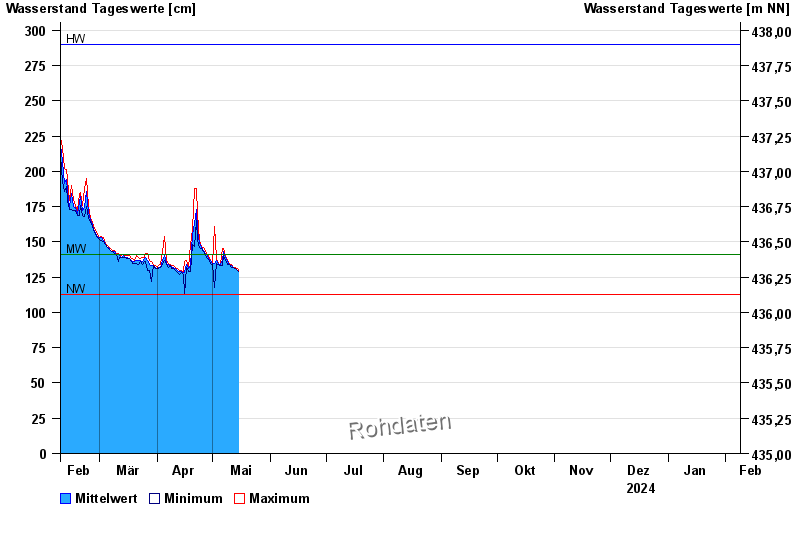
| Date | Mean value [cm] | Maximum [cm] | Minimum [cm] |
|---|---|---|---|
| 05.05.2024 | 134 | 134 | 133 |
| 04.05.2024 | 135 | 135 | 134 |
| 03.05.2024 | 137 | 138 | 135 |
| 02.05.2024 | 135 | 161 | 118 |
| 01.05.2024 | 135 | 135 | 134 |
| 30.04.2024 | 137 | 137 | 135 |
| 29.04.2024 | 137 | 138 | 137 |
© Bayerisches Landesamt für Umwelt 2024