
- Start >
- Rivers >
- Waterlevel >
- Bayern >
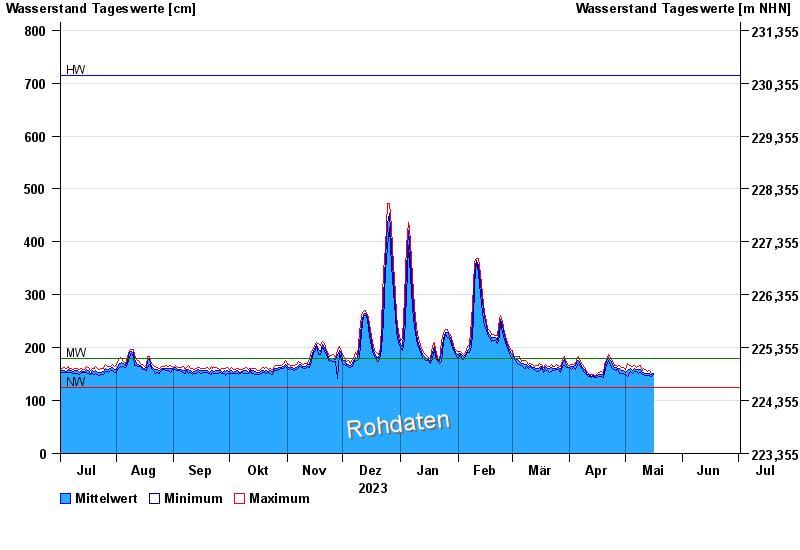
- Trunstadt >
- Chart of year

Chart of year Trunstadt / Main
Waterlevel from 02.07.2023 to 01.07.2024
| Date | Mean value [cm] | Maximum [cm] | Minimum [cm] |
|---|---|---|---|
| 06.06.2024 | 231 | 233 | 230 |
| 05.06.2024 | 251 | 276 | 231 |
| 04.06.2024 | 299 | 313 | 277 |
| 03.06.2024 | 302 | 317 | 274 |
| 02.06.2024 | 238 | 273 | 199 |
| 01.06.2024 | 177 | 199 | 167 |
| 31.05.2024 | 167 | 173 | 161 |
© Bayerisches Landesamt für Umwelt 2024