
- Start >
- Rivers >
- Waterlevel >
- Bayern >
- Trunstadt >
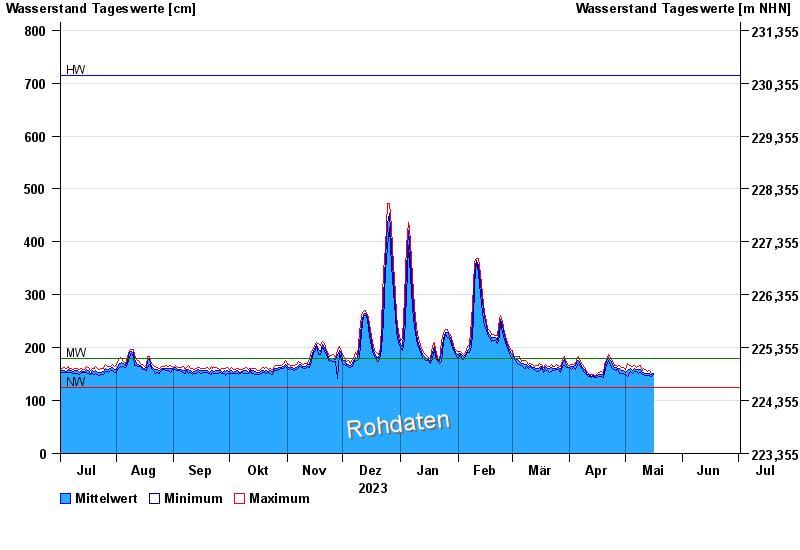
- Chart of year

Chart of year Trunstadt / Main
Waterlevel from 02.07.2023 to 01.07.2024
| Date | Mean value [cm] | Maximum [cm] | Minimum [cm] |
|---|---|---|---|
| 01.07.2024 | 166 | 170 | 163 |
| 30.06.2024 | 162 | 166 | 159 |
| 29.06.2024 | 171 | 179 | 163 |
| 28.06.2024 | 167 | 171 | 161 |
| 27.06.2024 | 161 | 164 | 155 |
| 26.06.2024 | 159 | 164 | 156 |
| 25.06.2024 | 160 | 164 | 157 |
© Bayerisches Landesamt für Umwelt 2024