
- Start >
- Rivers >
- Waterlevel >
- Bayern >
- Trostberg >
- Chart of total period

Chart of total period Trostberg / Alz
Waterlevel from 01.11.1969 to 03.05.2024
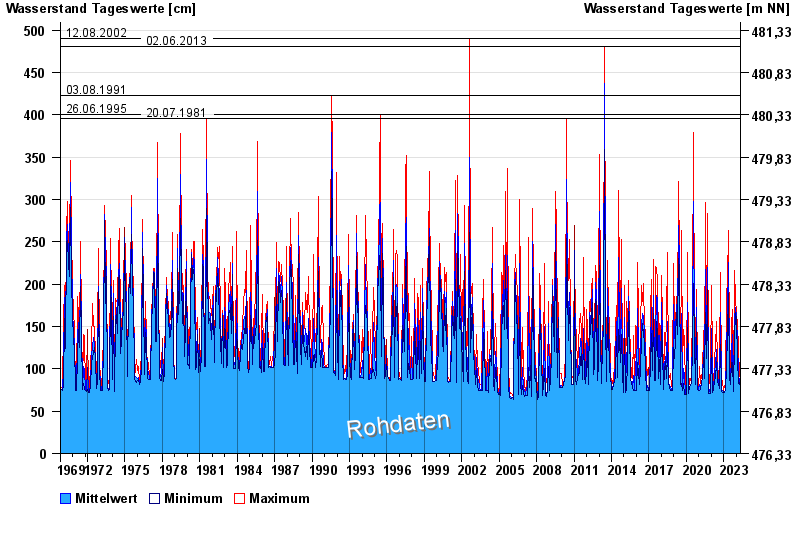
- 12.08.2002 Wasserstand: 490 cm
- 02.06.2013 Wasserstand: 481 cm
- 03.08.1991 Wasserstand: 423 cm
- 26.06.1995 Wasserstand: 401 cm
- 20.07.1981 Wasserstand: 396 cm
| Date | Mean value [cm] | Maximum [cm] | Minimum [cm] |
|---|---|---|---|
| 03.05.2024 | 87 | 87 | 86 |
| 02.05.2024 | 87 | 87 | 86 |
| 01.05.2024 | 86 | 87 | 82 |
| 30.04.2024 | 82 | 84 | 82 |
| 29.04.2024 | 83 | 92 | 82 |
| 28.04.2024 | 83 | 83 | 82 |
| 27.04.2024 | 82 | 83 | 82 |
© Bayerisches Landesamt für Umwelt 2024