
- Start >
- Rivers >
- Waterlevel >
- Bayern >
- Treuchtlingen >
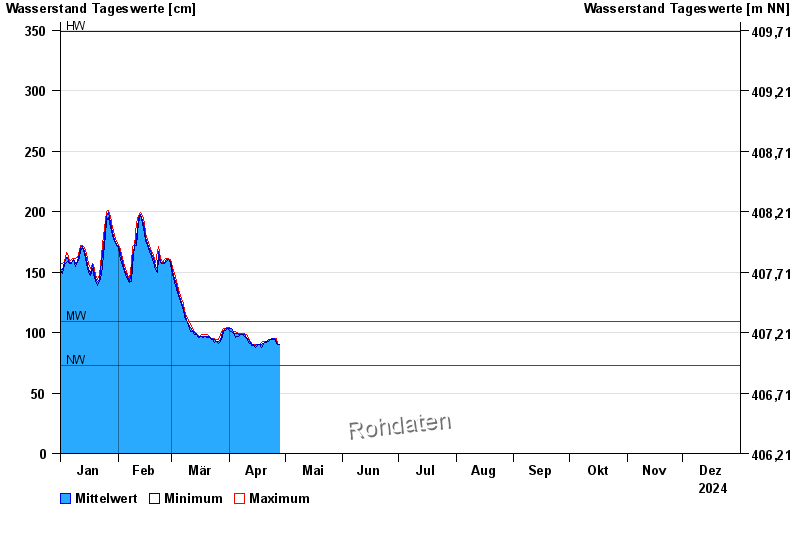
- Chart of year

Chart of year Treuchtlingen / Altmühl
Waterlevel from 01.01.2024 to 31.12.2024
| Date | Mean value [cm] | Maximum [cm] | Minimum [cm] |
|---|---|---|---|
| 20.05.2024 | 93 | 94 | 91 |
| 19.05.2024 | 93 | 94 | 92 |
| 18.05.2024 | 91 | 92 | 88 |
| 17.05.2024 | 86 | 87 | 85 |
| 16.05.2024 | 85 | 88 | 83 |
| 15.05.2024 | 86 | 86 | 85 |
| 14.05.2024 | 86 | 88 | 84 |
© Bayerisches Landesamt für Umwelt 2024