
- Start >
- Rivers >
- Waterlevel >
- Bayern >
- Treuchtlingen >
- Chart of year

Chart of year Treuchtlingen / Altmühl
Waterlevel from 01.01.2024 to 31.12.2024
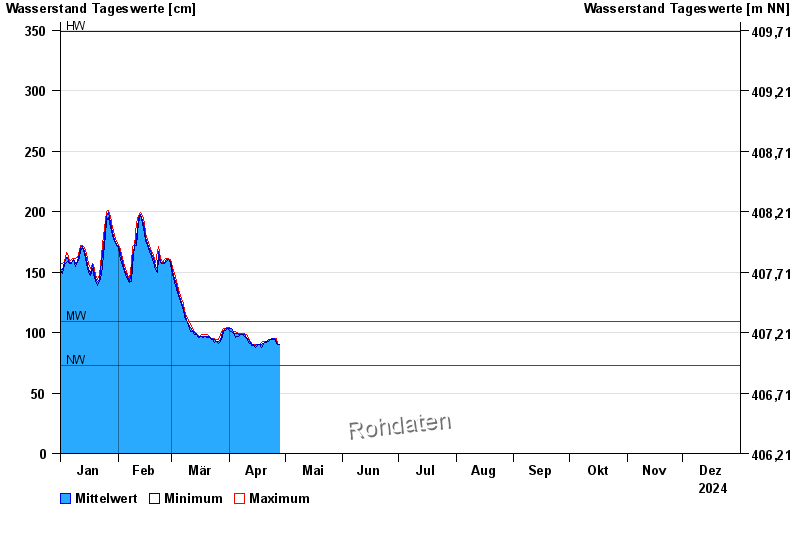
| Date | Mean value [cm] | Maximum [cm] | Minimum [cm] |
|---|---|---|---|
| 03.06.2024 | 168 | 169 | 167 |
| 02.06.2024 | 182 | 214 | 168 |
| 01.06.2024 | 192 | 231 | 136 |
| 31.05.2024 | 105 | 135 | 99 |
| 30.05.2024 | 101 | 102 | 100 |
| 29.05.2024 | 99 | 101 | 98 |
| 28.05.2024 | 99 | 99 | 98 |
© Bayerisches Landesamt für Umwelt 2024