
- Start >
- Rivers >
- Waterlevel >
- Bayern >
- Stanggass >
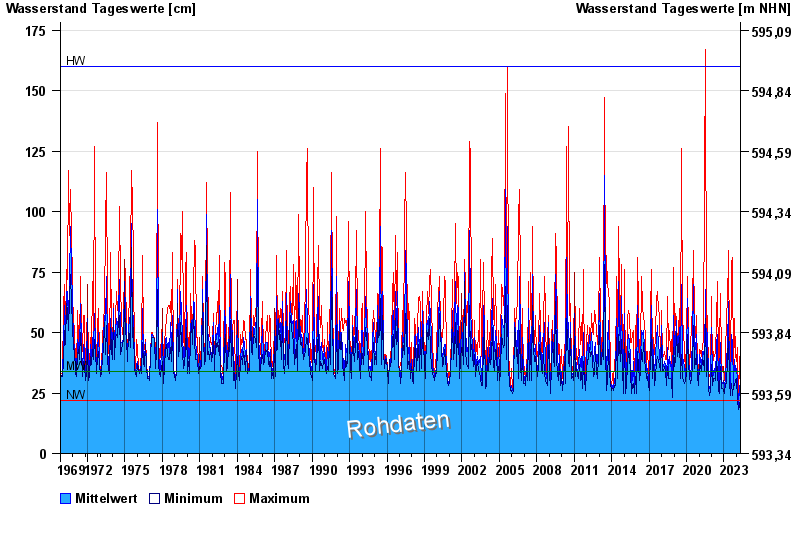
- Chart of total period

Chart of total period Stanggass / Bischofswieser Ache
Waterlevel from 01.11.1969 to 28.04.2024
| Date | Mean value [cm] | Maximum [cm] | Minimum [cm] |
|---|---|---|---|
| 28.04.2024 | 19 | 24 | 16 |
| 27.04.2024 | 17 | 22 | 14 |
| 26.04.2024 | 14 | 17 | 12 |
| 25.04.2024 | 13 | 13 | 13 |
| 24.04.2024 | 14 | 14 | 13 |
| 23.04.2024 | 14 | 14 | 13 |
| 22.04.2024 | 14 | 15 | 14 |
© Bayerisches Landesamt für Umwelt 2024