
- Start >
- Rivers >
- Waterlevel >
- Bayern >
- Seeshaupt >
- Chart of total period

Chart of total period Seeshaupt / Steinbach
Waterlevel from 01.11.1980 to 10.05.2024
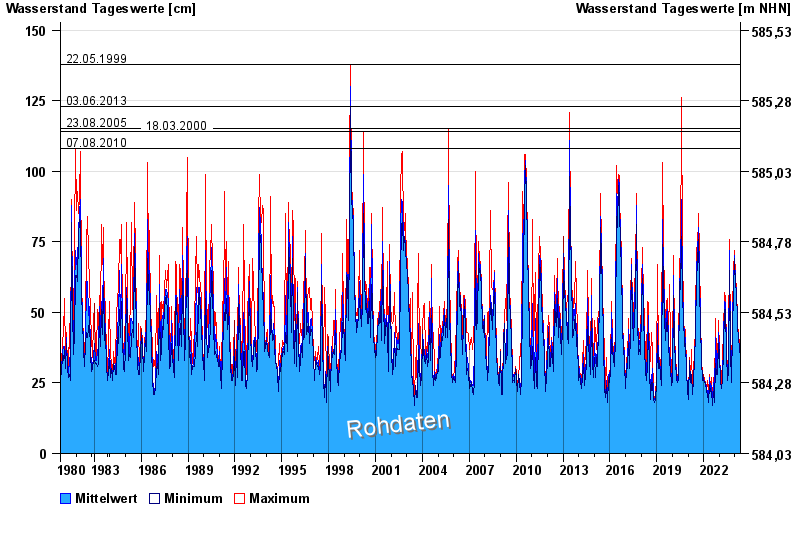
- 22.05.1999 Wasserstand: 138 cm
- 03.06.2013 Wasserstand: 123 cm
- 23.08.2005 Wasserstand: 115 cm
- 18.03.2000 Wasserstand: 114 cm
- 07.08.2010 Wasserstand: 108 cm
| Date | Mean value [cm] | Maximum [cm] | Minimum [cm] |
|---|---|---|---|
| 10.05.2024 | 33 | 34 | 32 |
| 09.05.2024 | 34 | 34 | 33 |
| 08.05.2024 | 33 | 34 | 32 |
| 07.05.2024 | 32 | 32 | 31 |
| 06.05.2024 | 30 | 32 | 30 |
| 05.05.2024 | 30 | 30 | 30 |
| 04.05.2024 | 31 | 31 | 30 |
© Bayerisches Landesamt für Umwelt 2024