
- Start >
- Rivers >
- Waterlevel >
- Bayern >
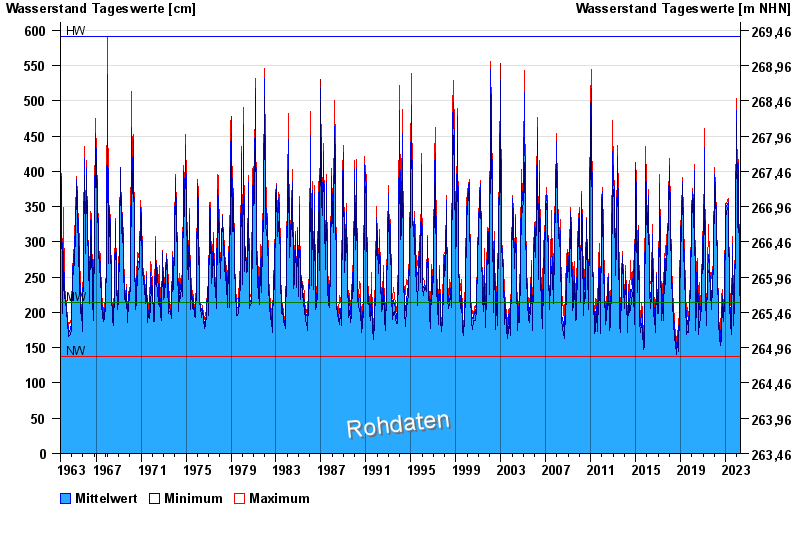
- Schwürbitz >
- Chart of total period

Chart of total period Schwürbitz / Main
Waterlevel from 01.11.1963 to 28.04.2024
| Date | Mean value [cm] | Maximum [cm] | Minimum [cm] |
|---|---|---|---|
| 28.04.2024 | 209 | 210 | 208 |
| 27.04.2024 | 214 | 220 | 210 |
| 26.04.2024 | 224 | 228 | 219 |
| 25.04.2024 | 225 | 227 | 223 |
| 24.04.2024 | 228 | 234 | 225 |
| 23.04.2024 | 239 | 249 | 234 |
| 22.04.2024 | 254 | 256 | 249 |
© Bayerisches Landesamt für Umwelt 2024