
- Start >
- Rivers >
- Waterlevel >
- Bayern >
- Schweinfurt Neuer Hafen >
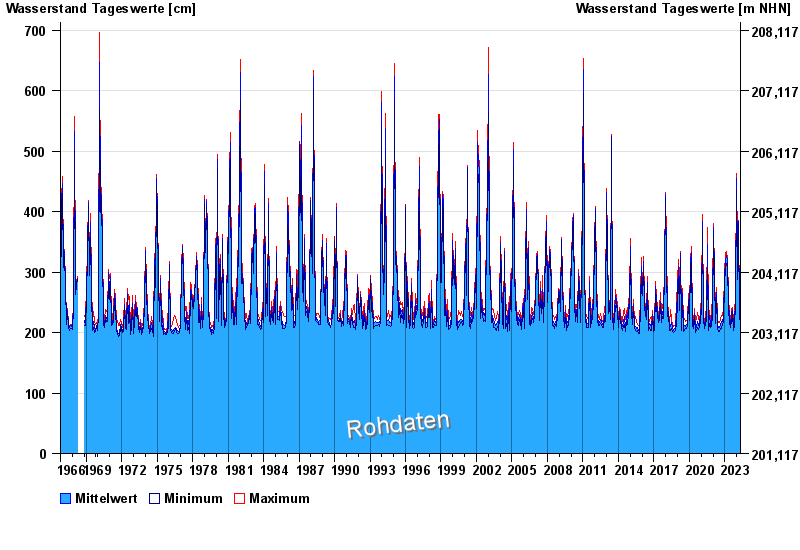
- Chart of total period

Chart of total period Schweinfurt Neuer Hafen / Main
Waterlevel from 01.11.1966 to 26.04.2024
| Date | Mean value [cm] | Maximum [cm] | Minimum [cm] |
|---|---|---|---|
| 26.04.2024 | 225 | 228 | 222 |
| 25.04.2024 | 229 | 234 | 226 |
| 24.04.2024 | 233 | 238 | 225 |
| 23.04.2024 | 239 | 245 | 232 |
| 22.04.2024 | 242 | 246 | 238 |
| 21.04.2024 | 237 | 243 | 233 |
| 20.04.2024 | 226 | 232 | 218 |
© Bayerisches Landesamt für Umwelt 2024