
- Start >
- Rivers >
- Waterlevel >
- Bayern >
- Schönberg >
- Chart of year

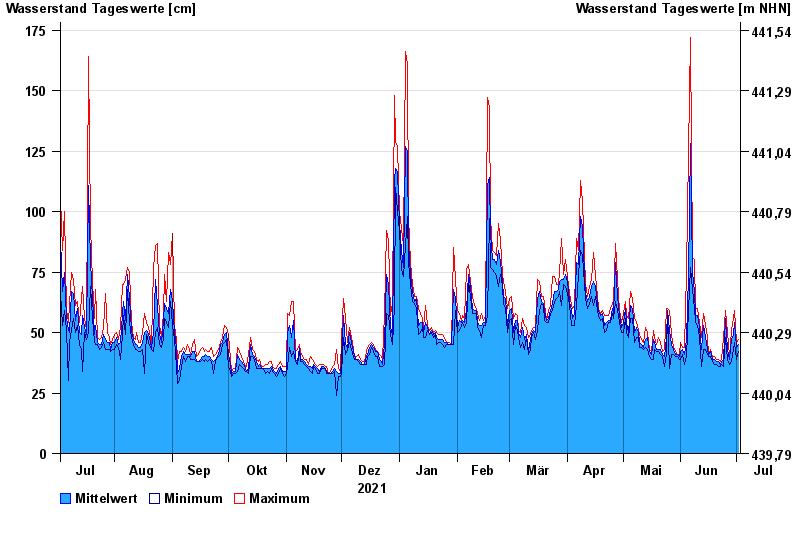
Chart of year Schönberg / Große Ohe
Waterlevel from 03.07.2021 to 02.07.2022
- 13.08.2002 Wasserstand: 243 cm
- 21.12.1993 Wasserstand: 237 cm
- 22.07.1980 Wasserstand: 235 cm
- 15.09.1998 Wasserstand: 219 cm
- 05.01.2013 Wasserstand: 215 cm
| Date | Mean value [cm] | Maximum [cm] | Minimum [cm] |
|---|---|---|---|
| 02.07.2022 | 45 | 47 | 42 |
| 01.07.2022 | 44 | 46 | 39 |
| 30.06.2022 | 54 | 59 | 46 |
| 29.06.2022 | 49 | 56 | 43 |
| 28.06.2022 | 47 | 51 | 38 |
| 27.06.2022 | 39 | 40 | 37 |
| 26.06.2022 | 43 | 50 | 39 |
© Bayerisches Landesamt für Umwelt 2024