
- Start >
- Rivers >
- Waterlevel >
- Bayern >
- Roth Bleiche >
- Chart of total period

Chart of total period Roth Bleiche / Roth
Waterlevel from 13.05.1968 to 10.05.2024
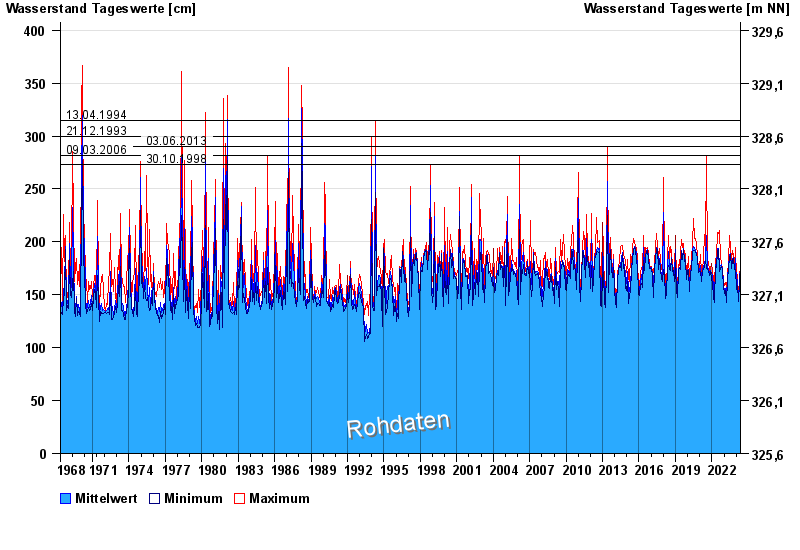
- 13.04.1994 Wasserstand: 315 cm
- 21.12.1993 Wasserstand: 300 cm
- 03.06.2013 Wasserstand: 290 cm
- 09.03.2006 Wasserstand: 282 cm
- 30.10.1998 Wasserstand: 273 cm
| Date | Mean value [cm] | Maximum [cm] | Minimum [cm] |
|---|---|---|---|
| 10.05.2024 | 176 | 176 | 176 |
| 09.05.2024 | 177 | 177 | 176 |
| 08.05.2024 | 177 | 178 | 176 |
| 07.05.2024 | 177 | 178 | 177 |
| 06.05.2024 | 178 | 179 | 177 |
| 05.05.2024 | 177 | 179 | 177 |
| 04.05.2024 | 177 | 178 | 176 |
© Bayerisches Landesamt für Umwelt 2024