
- Start >
- Rivers >
- Waterlevel >
- Bayern >
- Reupelsdorf >
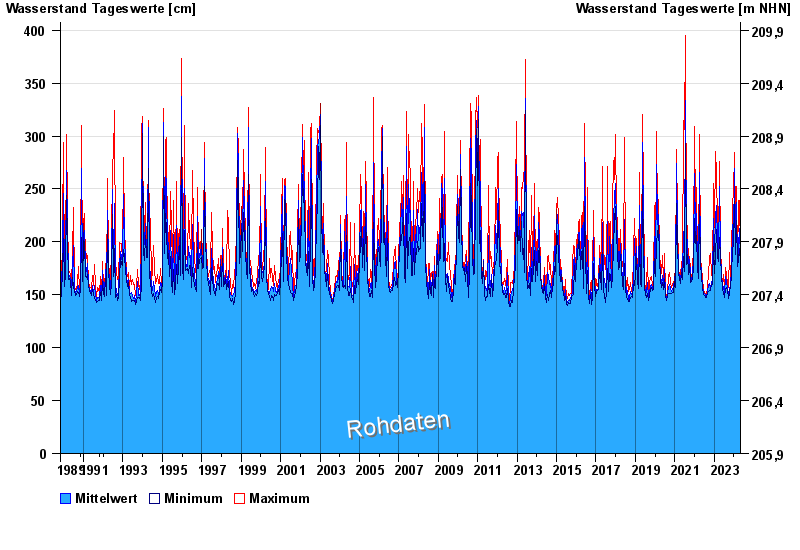
- Chart of total period

Chart of total period Reupelsdorf / Schwarzach
Waterlevel from 01.11.1989 to 01.05.2024
| Date | Mean value [cm] | Maximum [cm] | Minimum [cm] |
|---|---|---|---|
| 01.05.2024 | 167 | 167 | 166 |
| 30.04.2024 | 168 | 169 | 167 |
| 29.04.2024 | 169 | 178 | 168 |
| 28.04.2024 | 171 | 172 | 170 |
| 27.04.2024 | 174 | 176 | 172 |
| 26.04.2024 | 177 | 179 | 175 |
| 25.04.2024 | 180 | 182 | 179 |
© Bayerisches Landesamt für Umwelt 2024