
- Start >
- Rivers >
- Waterlevel >
- Bayern >
- Poppenlauer >
- Chart of total period

Chart of total period Poppenlauer / Lauer
Waterlevel from 01.11.1968 to 26.04.2024
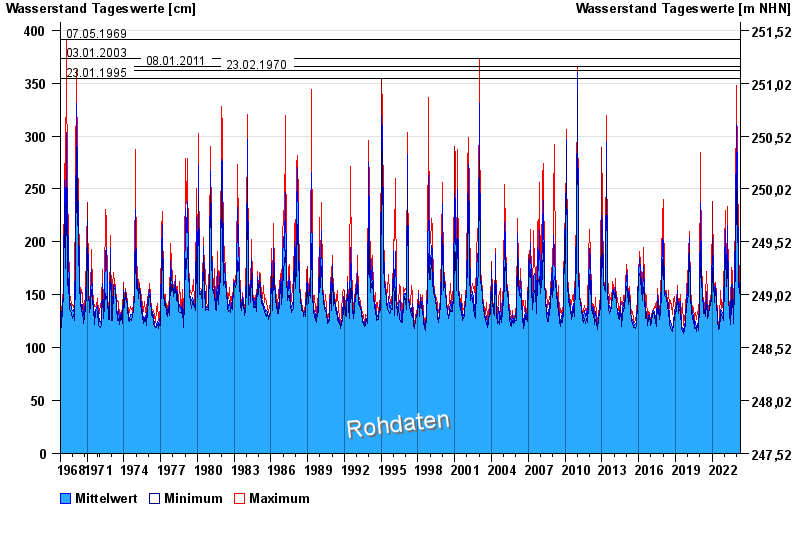
- 07.05.1969 Wasserstand: 391 cm
- 03.01.2003 Wasserstand: 373 cm
- 08.01.2011 Wasserstand: 366 cm
- 23.02.1970 Wasserstand: 362 cm
- 23.01.1995 Wasserstand: 354 cm
| Date | Mean value [cm] | Maximum [cm] | Minimum [cm] |
|---|---|---|---|
| 26.04.2024 | 148 | 148 | 148 |
| 25.04.2024 | 147 | 148 | 147 |
| 24.04.2024 | 148 | 149 | 147 |
| 23.04.2024 | 151 | 155 | 149 |
| 22.04.2024 | 158 | 165 | 155 |
| 21.04.2024 | 157 | 166 | 145 |
| 20.04.2024 | 147 | 150 | 144 |
© Bayerisches Landesamt für Umwelt 2024