
- Start >
- Rivers >
- Waterlevel >
- Bayern >
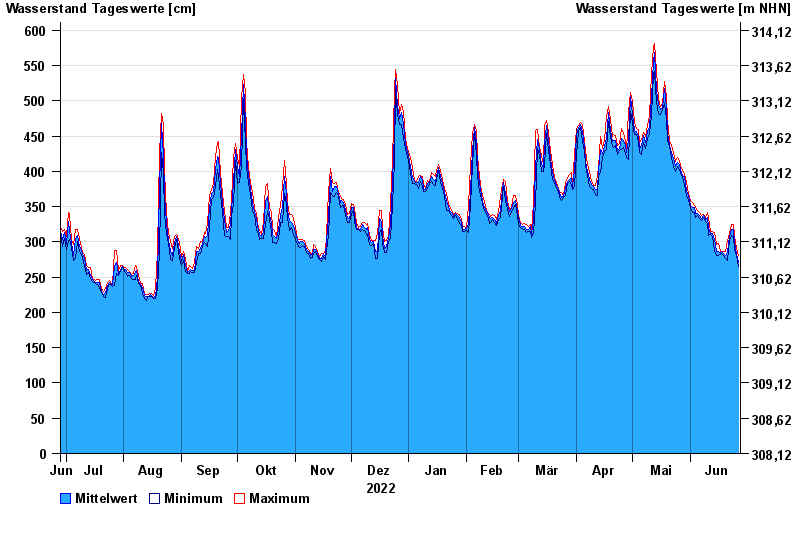
- Pfelling >
- Chart of year

Chart of year Pfelling / Donau
Waterlevel from 28.06.2022 to 27.06.2023
- 05.06.2013 Wasserstand: 898 cm
- 28.01.1941 Wasserstand: 856 cm
- 15.08.2002 Wasserstand: 847 cm
- 28.03.1988 Wasserstand: 837 cm
- 16.01.2011 Wasserstand: 827 cm
| Date | Mean value [cm] | Maximum [cm] | Minimum [cm] |
|---|---|---|---|
| 27.06.2023 | 271 | 280 | 265 |
| 26.06.2023 | 284 | 290 | 280 |
| 25.06.2023 | 299 | 309 | 289 |
| 24.06.2023 | 318 | 325 | 307 |
| 23.06.2023 | 318 | 324 | 309 |
| 22.06.2023 | 308 | 312 | 302 |
| 21.06.2023 | 285 | 302 | 274 |
© Bayerisches Landesamt für Umwelt 2024