
- Start >
- Rivers >
- Waterlevel >
- Bayern >
- Pfelling >
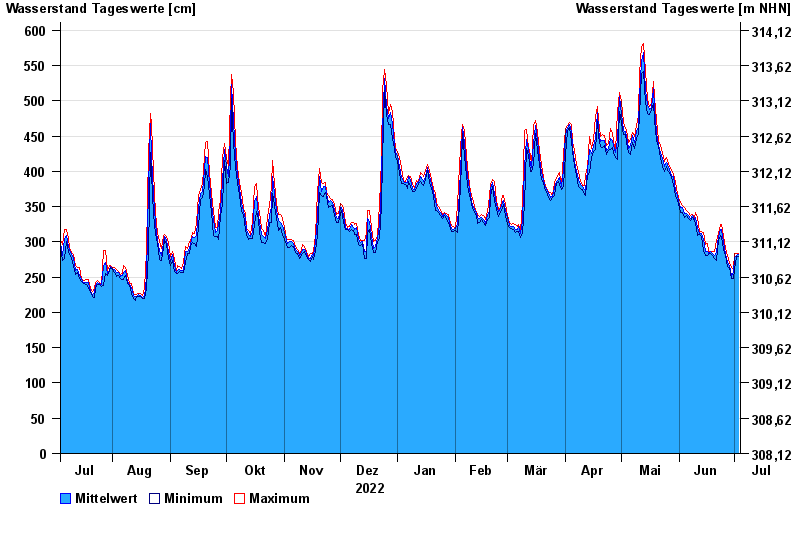
- Chart of year

Chart of year Pfelling / Donau
Waterlevel from 04.07.2022 to 03.07.2023
- 05.06.2013 Wasserstand: 898 cm
- 28.01.1941 Wasserstand: 856 cm
- 15.08.2002 Wasserstand: 847 cm
- 28.03.1988 Wasserstand: 837 cm
- 16.01.2011 Wasserstand: 827 cm
| Date | Mean value [cm] | Maximum [cm] | Minimum [cm] |
|---|---|---|---|
| 03.07.2023 | 282 | 283 | 279 |
| 02.07.2023 | 281 | 284 | 279 |
| 01.07.2023 | 278 | 283 | 261 |
| 30.06.2023 | 256 | 261 | 248 |
| 29.06.2023 | 252 | 264 | 248 |
| 28.06.2023 | 267 | 270 | 263 |
| 27.06.2023 | 271 | 280 | 265 |
© Bayerisches Landesamt für Umwelt 2024