
- Start >
- Rivers >
- Waterlevel >
- Bayern >
- Oberstdorf >
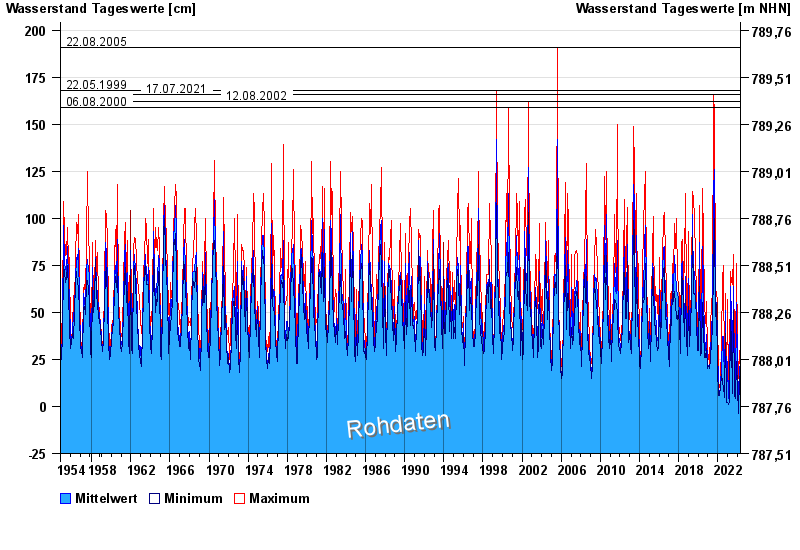
- Chart of total period

Chart of total period Oberstdorf / Trettach
Waterlevel from 25.10.1954 to 28.04.2024
Messwerte unsicher
Wegen Baumaßnahme instabiles Querprofil
- 22.08.2005 Wasserstand: 191 cm
- 22.05.1999 Wasserstand: 168 cm
- 17.07.2021 Wasserstand: 166 cm
- 12.08.2002 Wasserstand: 162 cm
- 06.08.2000 Wasserstand: 159 cm
| Date | Mean value [cm] | Maximum [cm] | Minimum [cm] |
|---|---|---|---|
| 28.04.2024 | -2 | -2 | -2 |
| 27.04.2024 | -2 | -2 | -2 |
| 26.04.2024 | -2 | -2 | -2 |
| 25.04.2024 | -2 | -2 | -2 |
| 24.04.2024 | -2 | -2 | -2 |
| 23.04.2024 | -1 | -1 | -2 |
| 22.04.2024 | -3 | -1 | -4 |
© Bayerisches Landesamt für Umwelt 2024