
- Start >
- Rivers >
- Waterlevel >
- Bayern >
- Oberstaufen >
- Chart of total period

Chart of total period Oberstaufen / Weißach
Waterlevel from 01.11.1969 to 03.05.2024
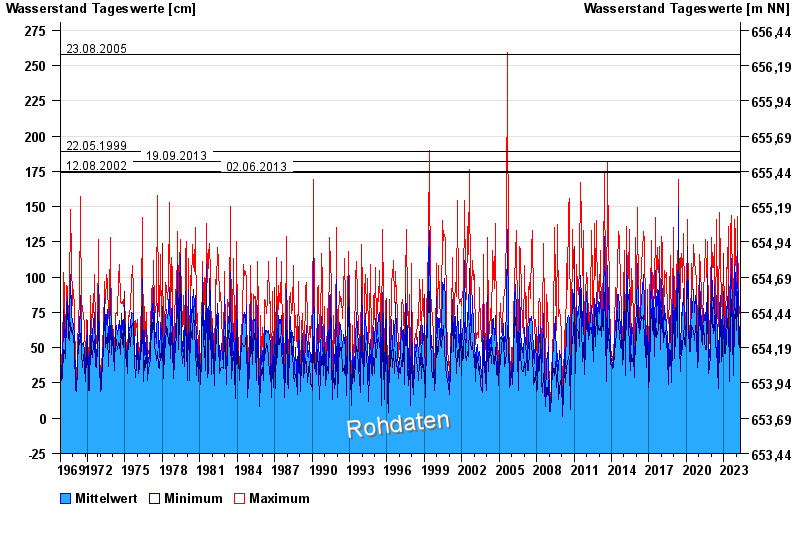
- 23.08.2005 Wasserstand: 258 cm
- 22.05.1999 Wasserstand: 189 cm
- 19.09.2013 Wasserstand: 182 cm
- 12.08.2002 Wasserstand: 175 cm
- 02.06.2013 Wasserstand: 174 cm
| Date | Mean value [cm] | Maximum [cm] | Minimum [cm] |
|---|---|---|---|
| 03.05.2024 | 64 | 65 | 64 |
| 02.05.2024 | 67 | 72 | 63 |
| 01.05.2024 | 72 | 81 | 65 |
| 30.04.2024 | 75 | 83 | 68 |
| 29.04.2024 | 72 | 85 | 61 |
| 28.04.2024 | 70 | 79 | 65 |
| 27.04.2024 | 57 | 71 | 48 |
© Bayerisches Landesamt für Umwelt 2024