
- Start >
- Rivers >
- Waterlevel >
- Bayern >
- Oberndorf >
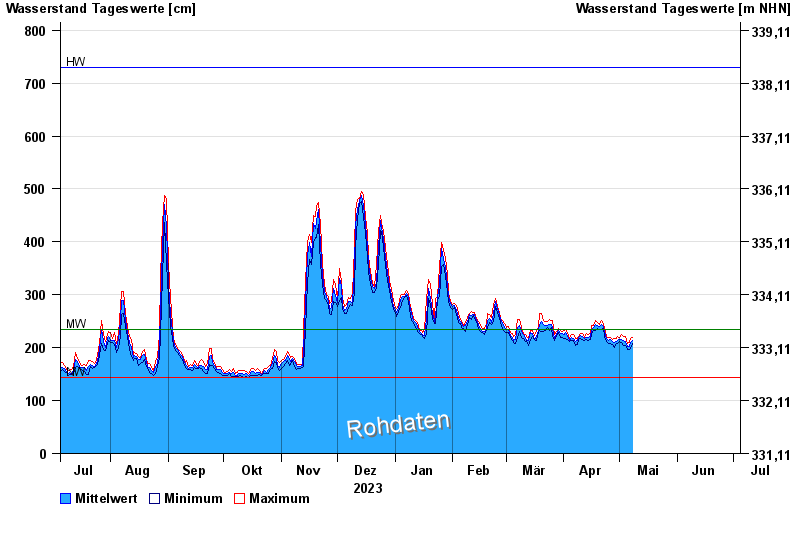
- Chart of year

Chart of year Oberndorf / Donau
Waterlevel from 05.07.2023 to 04.07.2024
| Date | Mean value [cm] | Maximum [cm] | Minimum [cm] |
|---|---|---|---|
| 08.05.2024 | 213 | 220 | 207 |
| 07.05.2024 | 209 | 218 | 199 |
| 06.05.2024 | 202 | 209 | 196 |
| 05.05.2024 | 202 | 207 | 196 |
| 04.05.2024 | 212 | 221 | 204 |
| 03.05.2024 | 214 | 222 | 205 |
| 02.05.2024 | 215 | 224 | 210 |
© Bayerisches Landesamt für Umwelt 2024