
- Start >
- Rivers >
- Waterlevel >
- Bayern >
- Oberndorf >
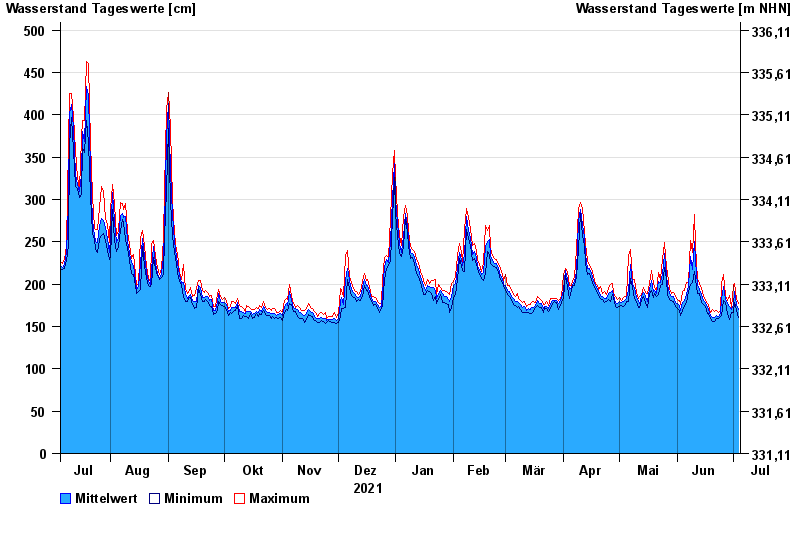
- Chart of year

Chart of year Oberndorf / Donau
Waterlevel from 05.07.2021 to 04.07.2022
- 24.05.1999 Wasserstand: 730 cm
- 04.06.2013 Wasserstand: 684 cm
- 26.08.2005 Wasserstand: 664 cm
- 16.04.1994 Wasserstand: 641 cm
- 14.08.2002 Wasserstand: 630 cm
| Date | Mean value [cm] | Maximum [cm] | Minimum [cm] |
|---|---|---|---|
| 04.07.2022 | 170 | 177 | 161 |
| 03.07.2022 | 176 | 182 | 169 |
| 02.07.2022 | 191 | 201 | 178 |
| 01.07.2022 | 176 | 198 | 166 |
| 30.06.2022 | 170 | 173 | 167 |
| 29.06.2022 | 174 | 187 | 158 |
| 28.06.2022 | 177 | 181 | 165 |
© Bayerisches Landesamt für Umwelt 2024