
- Start >
- Rivers >
- Waterlevel >
- Bayern >
- Oberndorf >
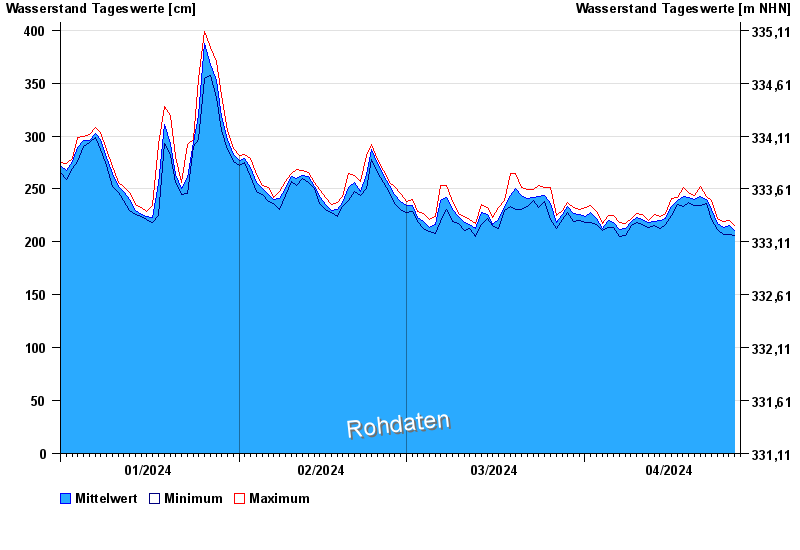
- Chart of year

Chart of year Oberndorf / Donau
Waterlevel from 01.01.2024 to 27.04.2024
- 24.05.1999 Wasserstand: 730 cm
- 04.06.2013 Wasserstand: 684 cm
- 26.08.2005 Wasserstand: 664 cm
- 16.04.1994 Wasserstand: 641 cm
- 14.08.2002 Wasserstand: 630 cm
| Date | Mean value [cm] | Maximum [cm] | Minimum [cm] |
|---|---|---|---|
| 27.04.2024 | 214 | 214 | 214 |
| 26.04.2024 | 215 | 220 | 207 |
| 25.04.2024 | 214 | 219 | 207 |
| 24.04.2024 | 217 | 222 | 212 |
| 23.04.2024 | 231 | 239 | 221 |
| 22.04.2024 | 240 | 243 | 236 |
| 21.04.2024 | 243 | 252 | 234 |
© Bayerisches Landesamt für Umwelt 2024