
- Start >
- Rivers >
- Waterlevel >
- Bayern >
- Obermühlhausen >
- Chart of year

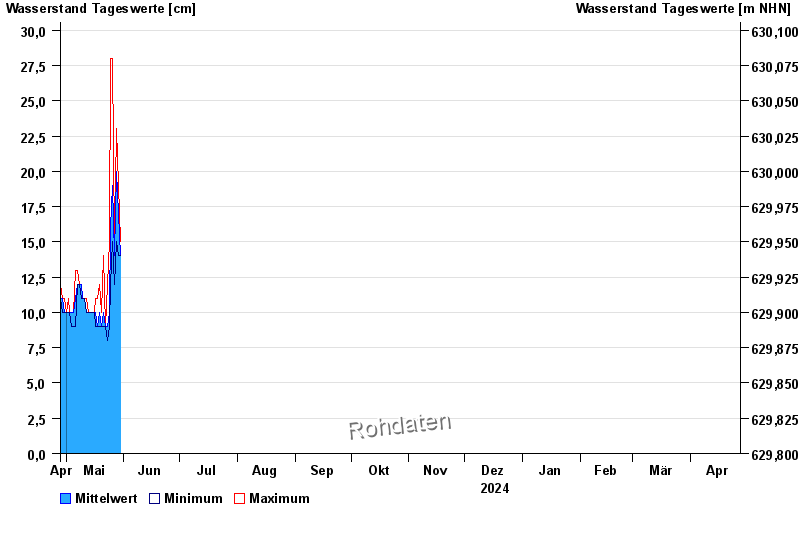
Chart of year Obermühlhausen / Beurerbach
Waterlevel from 28.04.2024 to 27.04.2025
- 29.05.2007 Wasserstand: 118 cm
- 30.06.2011 Wasserstand: 115 cm
- 02.06.2013 Wasserstand: 111 cm
- 03.06.2010 Wasserstand: 104 cm
- 23.08.2005 Wasserstand: 103 cm
| Date | Mean value [cm] | Maximum [cm] | Minimum [cm] |
|---|---|---|---|
| 08.05.2024 | 12 | 12 | 12 |
| 07.05.2024 | 12 | 13 | 12 |
| 06.05.2024 | 11 | 13 | 9 |
| 05.05.2024 | 10 | 10 | 9 |
| 04.05.2024 | 10 | 10 | 9 |
| 03.05.2024 | 10 | 10 | 10 |
| 02.05.2024 | 10 | 11 | 10 |
© Bayerisches Landesamt für Umwelt 2024