
- Start >
- Rivers >
- Waterlevel >
- Bayern >
- Nittenau >
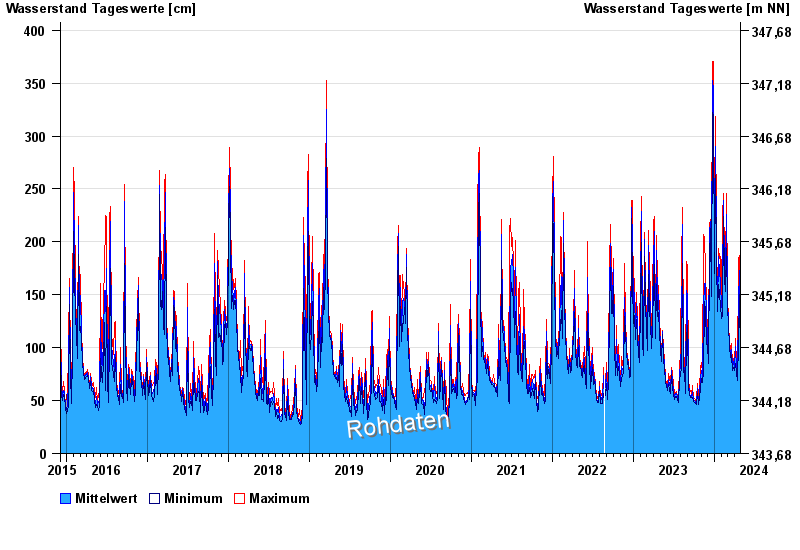
- Chart of total period

Chart of total period Nittenau / Regen
Waterlevel from 04.12.2015 to 26.04.2024
| Date | Mean value [cm] | Maximum [cm] | Minimum [cm] |
|---|---|---|---|
| 26.04.2024 | 90 | 91 | 90 |
| 25.04.2024 | 91 | 94 | 87 |
| 24.04.2024 | 98 | 105 | 93 |
| 23.04.2024 | 114 | 127 | 103 |
| 22.04.2024 | 139 | 150 | 128 |
| 21.04.2024 | 173 | 187 | 150 |
| 20.04.2024 | 143 | 183 | 106 |
© Bayerisches Landesamt für Umwelt 2024