
- Start >
- Rivers >
- Waterlevel >
- Bayern >
- Neustadt >
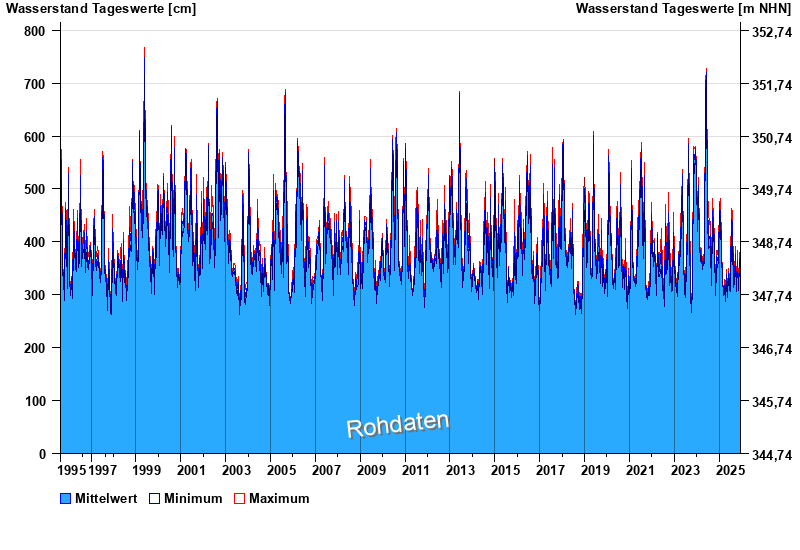
- Chart of total period

Chart of total period Neustadt / Donau
Waterlevel from 21.08.1995 to 16.12.2025
| Date | Mean value [cm] | Maximum [cm] | Minimum [cm] |
|---|---|---|---|
| 16.12.2025 | 311 | 312 | 309 |
| 15.12.2025 | 311 | 313 | 308 |
| 14.12.2025 | 315 | 317 | 314 |
| 13.12.2025 | 323 | 328 | 315 |
| 12.12.2025 | 330 | 333 | 328 |
| 11.12.2025 | 342 | 348 | 333 |
| 10.12.2025 | 359 | 366 | 349 |
© Bayerisches Landesamt für Umwelt 2025