
- Start >
- Rivers >
- Waterlevel >
- Bayern >
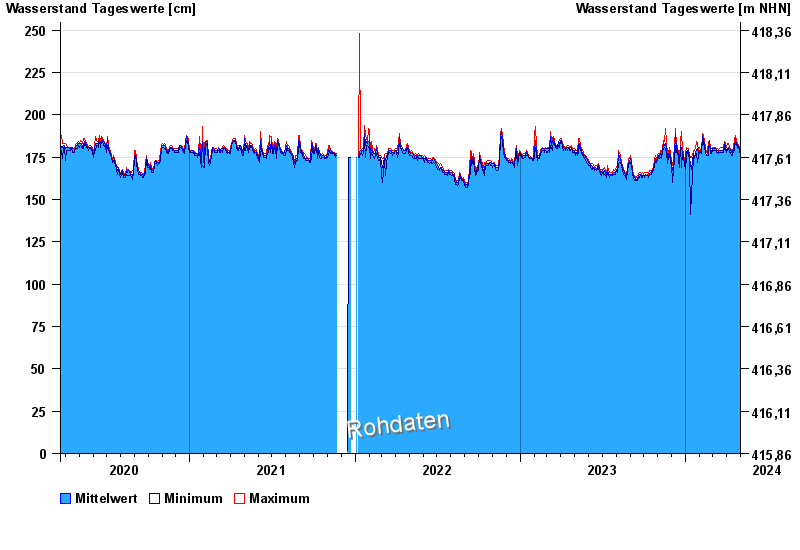
- Neumarkt Kanalhafen >
- Chart of total period

Chart of total period Neumarkt Kanalhafen / LDM-Kanal
Waterlevel from 21.03.2020 to 01.05.2024
 Für diesen Pegel sind keine historische Ereignisse hinterlegt.
| Date | Mean value [cm] | Maximum [cm] | Minimum [cm] |
|---|---|---|---|
| 01.05.2024 | 178 | 180 | 176 |
| 30.04.2024 | 179 | 181 | 178 |
| 29.04.2024 | 180 | 181 | 179 |
| 28.04.2024 | 181 | 182 | 179 |
| 27.04.2024 | 181 | 182 | 180 |
| 26.04.2024 | 182 | 183 | 181 |
| 25.04.2024 | 182 | 183 | 181 |
© Bayerisches Landesamt für Umwelt 2024