
- Start >
- Rivers >
- Waterlevel >
- Bayern >
- München >
- Chart of total period

Chart of total period München / Isar
Waterlevel from 01.11.1973 to 28.04.2024
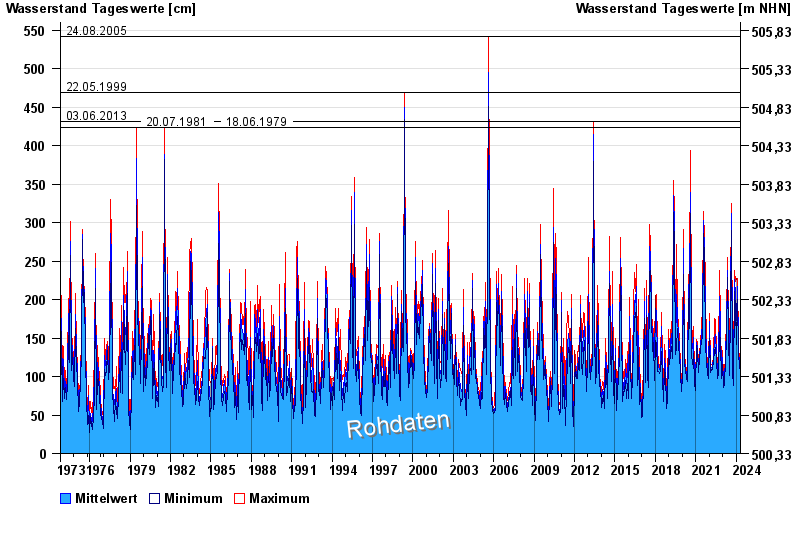
- 24.08.2005 Wasserstand: 542 cm
- 22.05.1999 Wasserstand: 469 cm
- 03.06.2013 Wasserstand: 432 cm
- 20.07.1981 Wasserstand: 424 cm
- 18.06.1979 Wasserstand: 424 cm
| Date | Mean value [cm] | Maximum [cm] | Minimum [cm] |
|---|---|---|---|
| 28.04.2024 | 124 | 128 | 117 |
| 27.04.2024 | 119 | 123 | 115 |
| 26.04.2024 | 118 | 123 | 114 |
| 25.04.2024 | 119 | 131 | 105 |
| 24.04.2024 | 125 | 137 | 108 |
| 23.04.2024 | 125 | 138 | 112 |
| 22.04.2024 | 111 | 116 | 106 |
© Bayerisches Landesamt für Umwelt 2024