
- Start >
- Rivers >
- Waterlevel >
- Bayern >
- Mühltal >
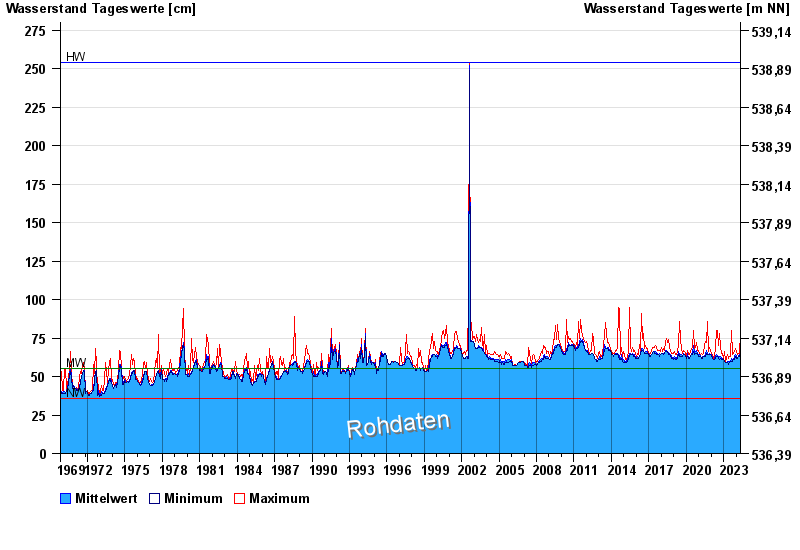
- Chart of total period

Chart of total period Mühltal / Glonn
Waterlevel from 01.11.1969 to 10.05.2024
| Date | Mean value [cm] | Maximum [cm] | Minimum [cm] |
|---|---|---|---|
| 10.05.2024 | 65 | 65 | 65 |
| 09.05.2024 | 65 | 65 | 65 |
| 08.05.2024 | 65 | 66 | 65 |
| 07.05.2024 | 65 | 65 | 65 |
| 06.05.2024 | 65 | 78 | 63 |
| 05.05.2024 | 63 | 64 | 63 |
| 04.05.2024 | 63 | 64 | 63 |
© Bayerisches Landesamt für Umwelt 2024