
- Start >
- Rivers >
- Waterlevel >
- Bayern >
- Moosburg >
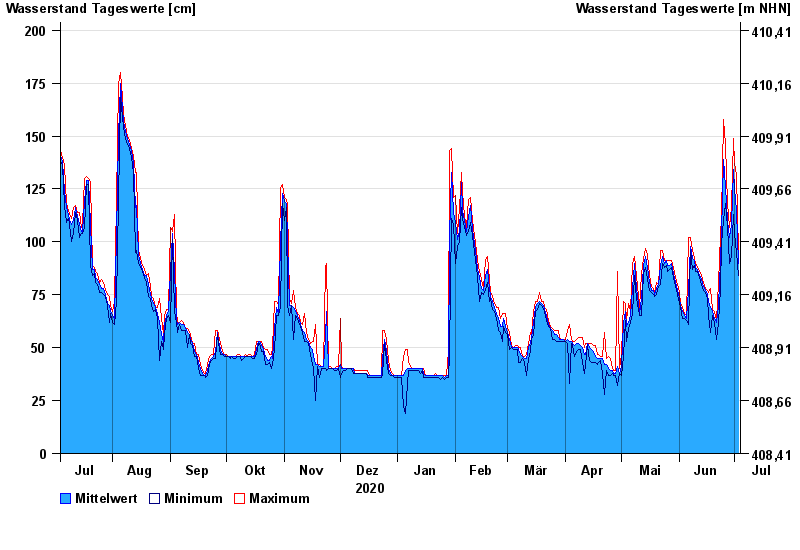
- Chart of year

Chart of year Moosburg / Amper
Waterlevel from 04.07.2020 to 03.07.2021
- 05.06.2013 Wasserstand: 363 cm
- 08.08.2010 Wasserstand: 272 cm
- 04.06.2010 Wasserstand: 257 cm
- 03.02.2013 Wasserstand: 242 cm
- 15.01.2019 Wasserstand: 241 cm
| Date | Mean value [cm] | Maximum [cm] | Minimum [cm] |
|---|---|---|---|
| 03.07.2021 | 90 | 95 | 84 |
| 02.07.2021 | 115 | 132 | 95 |
| 01.07.2021 | 125 | 137 | 104 |
| 30.06.2021 | 134 | 149 | 113 |
| 29.06.2021 | 108 | 116 | 93 |
| 28.06.2021 | 102 | 107 | 90 |
| 27.06.2021 | 110 | 118 | 107 |
© Bayerisches Landesamt für Umwelt 2024