
- Start >
- Rivers >
- Waterlevel >
- Bayern >
- Lenggries >
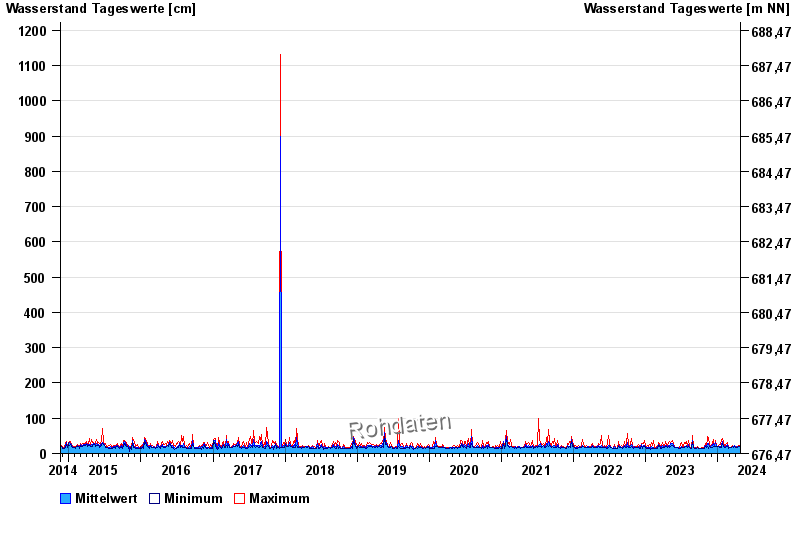
- Chart of total period

Chart of total period Lenggries / Arzbach
Waterlevel from 20.11.2014 to 26.04.2024
 Für diesen Pegel sind keine historische Ereignisse hinterlegt.
| Date | Mean value [cm] | Maximum [cm] | Minimum [cm] |
|---|---|---|---|
| 26.04.2024 | 19 | 20 | 19 |
| 25.04.2024 | 19 | 20 | 19 |
| 24.04.2024 | 18 | 20 | 18 |
| 23.04.2024 | 19 | 19 | 19 |
| 22.04.2024 | 20 | 21 | 19 |
| 21.04.2024 | 21 | 21 | 20 |
| 20.04.2024 | 21 | 23 | 21 |
© Bayerisches Landesamt für Umwelt 2024