
- Start >
- Rivers >
- Waterlevel >
- Bayern >
- Hörmanshofen >
- Chart of total period

Chart of total period Hörmanshofen / Geltnach
Waterlevel from 01.11.1963 to 26.04.2024
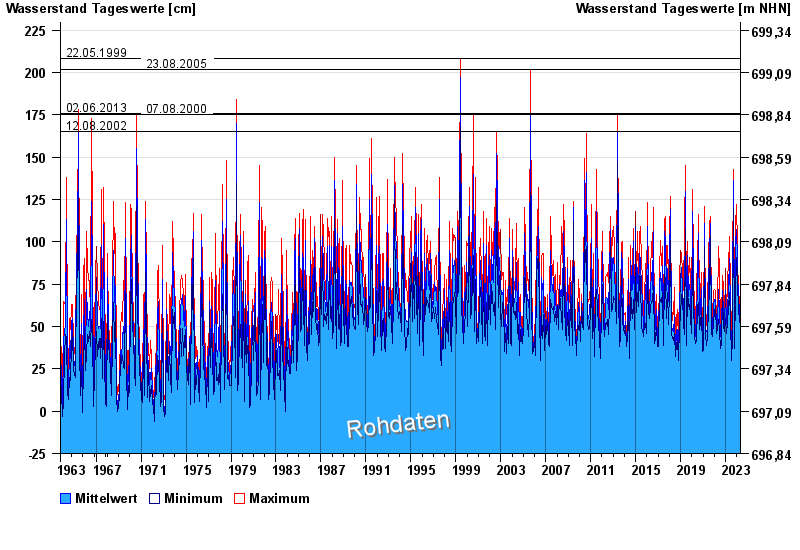
- 22.05.1999 Wasserstand: 208 cm
- 23.08.2005 Wasserstand: 202 cm
- 02.06.2013 Wasserstand: 176 cm
- 07.08.2000 Wasserstand: 175 cm
- 12.08.2002 Wasserstand: 165 cm
| Date | Mean value [cm] | Maximum [cm] | Minimum [cm] |
|---|---|---|---|
| 26.04.2024 | 46 | 49 | 44 |
| 25.04.2024 | 49 | 50 | 48 |
| 24.04.2024 | 48 | 49 | 47 |
| 23.04.2024 | 47 | 48 | 46 |
| 22.04.2024 | 50 | 53 | 47 |
| 21.04.2024 | 49 | 53 | 47 |
| 20.04.2024 | 49 | 50 | 47 |
© Bayerisches Landesamt für Umwelt 2024