
- Start >
- Rivers >
- Waterlevel >
- Bayern >
- Hiltmannsdorf HW >
- Chart of total period

Chart of total period Hiltmannsdorf HW / Farrnbach
Waterlevel from 04.04.2004 to 27.04.2024
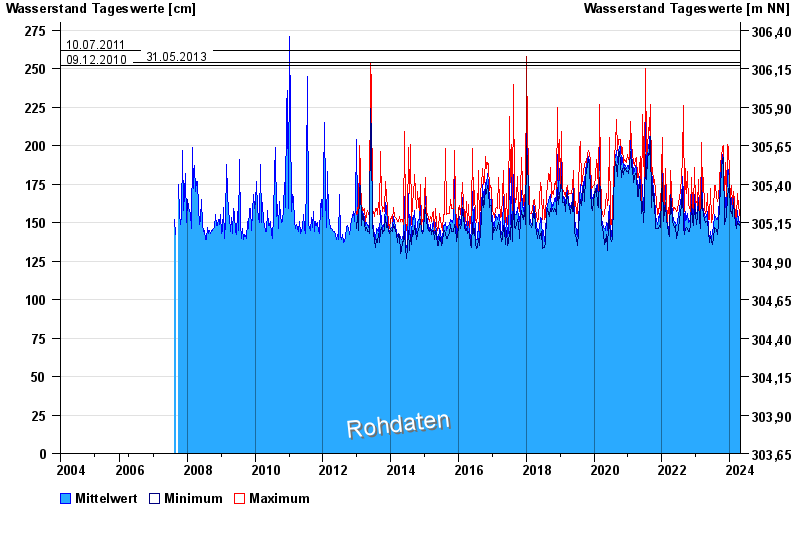
- 08.01.2011 Wasserstand: 280 cm
- 20.07.2011 Wasserstand: 278 cm
- 10.07.2011 Wasserstand: 262 cm
- 31.05.2013 Wasserstand: 254 cm
- 09.12.2010 Wasserstand: 252 cm
| Date | Mean value [cm] | Maximum [cm] | Minimum [cm] |
|---|---|---|---|
| 27.04.2024 | 146 | 148 | 145 |
| 26.04.2024 | 147 | 149 | 145 |
| 25.04.2024 | 148 | 151 | 145 |
| 24.04.2024 | 147 | 149 | 146 |
| 23.04.2024 | 148 | 150 | 146 |
| 22.04.2024 | 151 | 154 | 149 |
| 21.04.2024 | 151 | 157 | 148 |
© Bayerisches Landesamt für Umwelt 2024