
- Start >
- Rivers >
- Waterlevel >
- Bayern >
- Heinersdorf >
- Chart of year

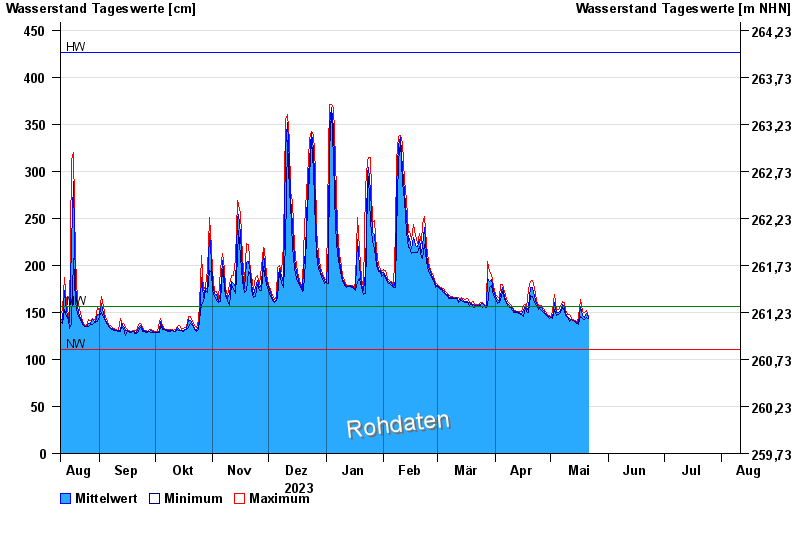
Chart of year Heinersdorf / Rodach
Waterlevel from 11.08.2023 to 10.08.2024
| Date | Mean value [cm] | Maximum [cm] | Minimum [cm] |
|---|---|---|---|
| 30.04.2024 | 146 | 147 | 145 |
| 29.04.2024 | 147 | 148 | 146 |
| 28.04.2024 | 149 | 151 | 148 |
| 27.04.2024 | 152 | 154 | 150 |
| 26.04.2024 | 155 | 157 | 152 |
| 25.04.2024 | 155 | 157 | 154 |
| 24.04.2024 | 155 | 157 | 153 |
© Bayerisches Landesamt für Umwelt 2024