
- Start >
- Rivers >
- Waterlevel >
- Bayern >
- Hechendorf >
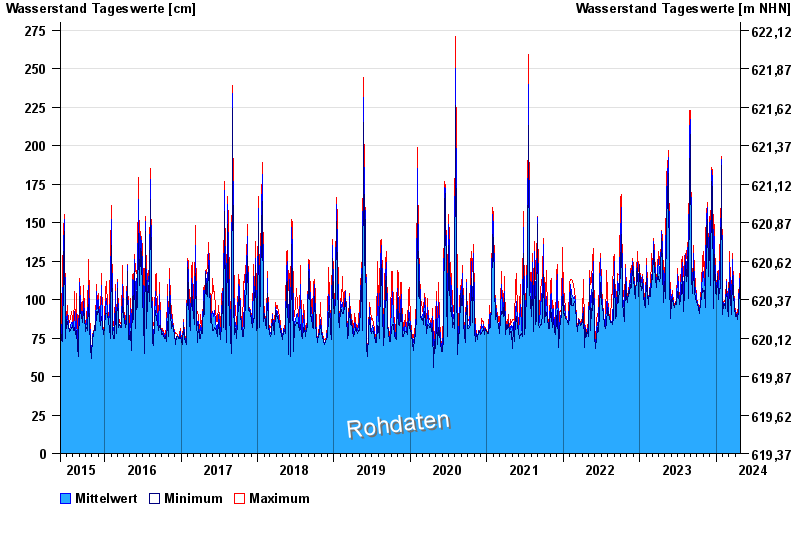
- Chart of total period

Chart of total period Hechendorf / Ramsach
Waterlevel from 04.06.2015 to 26.04.2024
 Für diesen Pegel sind keine Hochwassermarken hinterlegt.
note
Messwerte beeinflusst durch Kraftwerkssteuerungen.
| Date | Mean value [cm] | Maximum [cm] | Minimum [cm] |
|---|---|---|---|
| 26.04.2024 | 100 | 102 | 98 |
| 25.04.2024 | 105 | 108 | 102 |
| 24.04.2024 | 111 | 116 | 108 |
| 23.04.2024 | 114 | 117 | 107 |
| 22.04.2024 | 104 | 107 | 102 |
| 21.04.2024 | 102 | 104 | 100 |
| 20.04.2024 | 100 | 104 | 92 |
© Bayerisches Landesamt für Umwelt 2024