
- Start >
- Rivers >
- Waterlevel >
- Bayern >
- Hallerndorf >
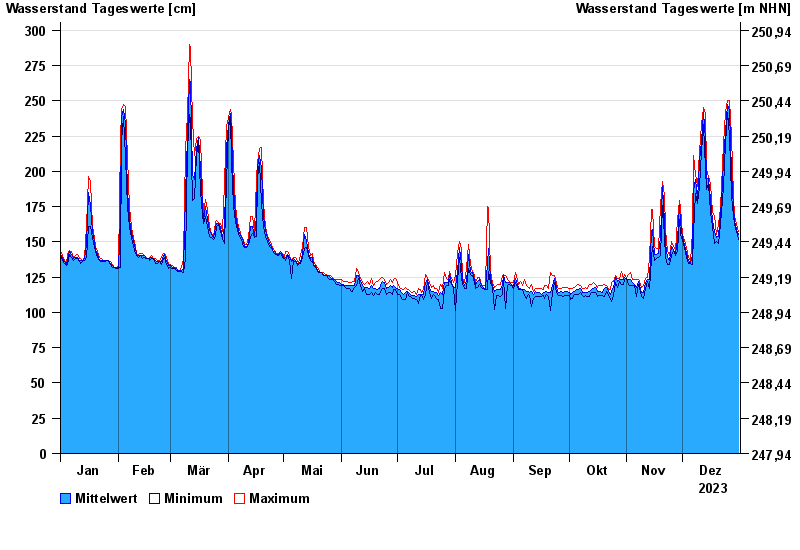
- Chart of year

Chart of year Hallerndorf / Aisch
Waterlevel from 01.01.2023 to 31.12.2023
| Date | Mean value [cm] | Maximum [cm] | Minimum [cm] |
|---|---|---|---|
| 31.12.2023 | 155 | 157 | 152 |
| 30.12.2023 | 159 | 162 | 157 |
| 29.12.2023 | 165 | 169 | 162 |
| 28.12.2023 | 174 | 182 | 169 |
| 27.12.2023 | 199 | 225 | 182 |
| 26.12.2023 | 243 | 250 | 225 |
| 25.12.2023 | 247 | 250 | 242 |
© Bayerisches Landesamt für Umwelt 2024