
- Start >
- Rivers >
- Waterlevel >
- Bayern >
- Greifenmühle >
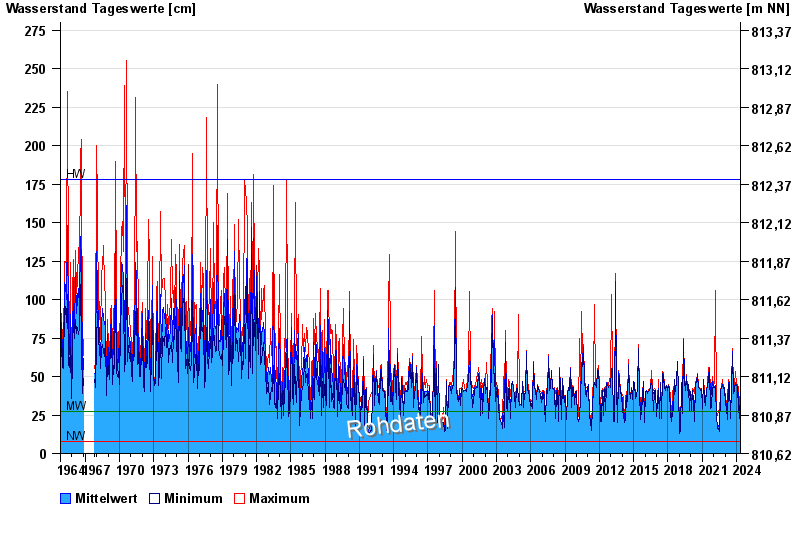
- Chart of total period

Chart of total period Greifenmühle / Rottach
Waterlevel from 01.11.1964 to 09.05.2024
| Date | Mean value [cm] | Maximum [cm] | Minimum [cm] |
|---|---|---|---|
| 09.05.2024 | 30 | 31 | 30 |
| 08.05.2024 | 30 | 33 | 22 |
| 07.05.2024 | 21 | 22 | 21 |
| 06.05.2024 | 23 | 30 | 21 |
| 05.05.2024 | 24 | 29 | 23 |
| 04.05.2024 | 24 | 24 | 23 |
| 03.05.2024 | 24 | 25 | 24 |
© Bayerisches Landesamt für Umwelt 2024