
- Start >
- Rivers >
- Waterlevel >
- Bayern >
- Grafrath >
- Chart of year

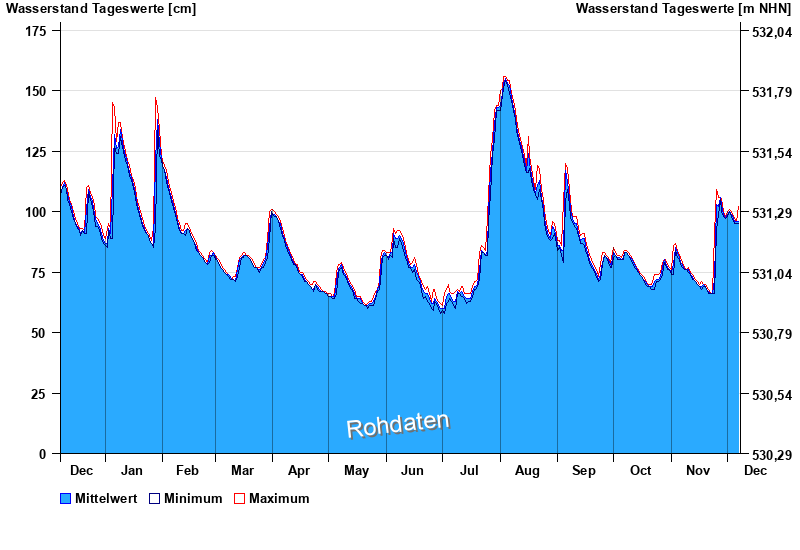
Chart of year Grafrath / Amper
Waterlevel from 08.12.2024 to 07.12.2025
| Date | Mean value [cm] | Maximum [cm] | Minimum [cm] |
|---|---|---|---|
| 07.12.2025 | 96 | 102 | 95 |
| 06.12.2025 | 96 | 96 | 95 |
| 05.12.2025 | 96 | 97 | 95 |
| 04.12.2025 | 97 | 98 | 96 |
| 03.12.2025 | 99 | 100 | 98 |
| 02.12.2025 | 100 | 101 | 100 |
| 01.12.2025 | 99 | 100 | 98 |
© Bayerisches Landesamt für Umwelt 2025