
- Start >
- Rivers >
- Waterlevel >
- Bayern >
- Grafenmühle >
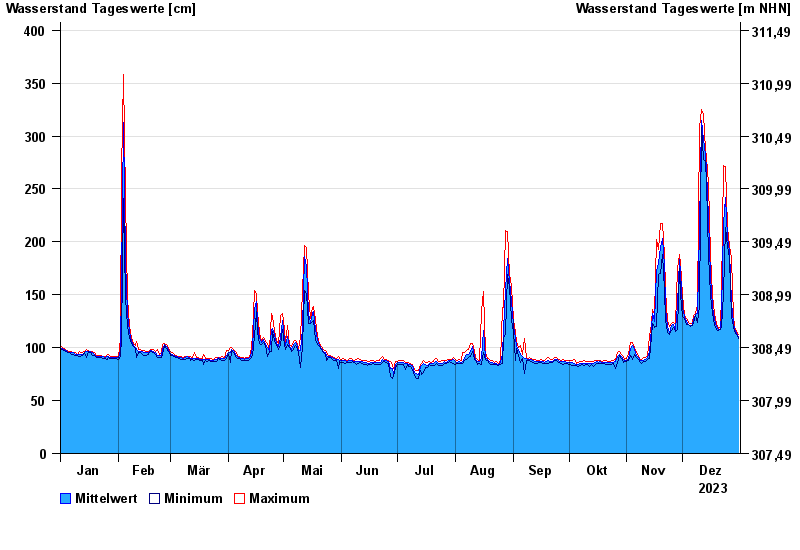
- Chart of year

Chart of year Grafenmühle / Vils
Waterlevel from 01.01.2023 to 31.12.2023
- 09.07.1954 Wasserstand: 802 cm
- 06.02.1945 Wasserstand: 635 cm
- 02.02.1923 Wasserstand: 585 cm
- 20.12.1922 Wasserstand: 560 cm
- 13.03.1947 Wasserstand: 559 cm
| Date | Mean value [cm] | Maximum [cm] | Minimum [cm] |
|---|---|---|---|
| 31.12.2023 | 110 | 112 | 109 |
| 30.12.2023 | 114 | 115 | 112 |
| 29.12.2023 | 117 | 120 | 115 |
| 28.12.2023 | 124 | 129 | 120 |
| 27.12.2023 | 142 | 184 | 129 |
| 26.12.2023 | 191 | 197 | 184 |
| 25.12.2023 | 204 | 214 | 196 |
© Bayerisches Landesamt für Umwelt 2025