
- Start >
- Rivers >
- Waterlevel >
- Bayern >
- Grabmühle >
- Chart of total period

Chart of total period Grabmühle / Donaumoos Ach
Waterlevel from 15.10.2008 to 29.04.2024
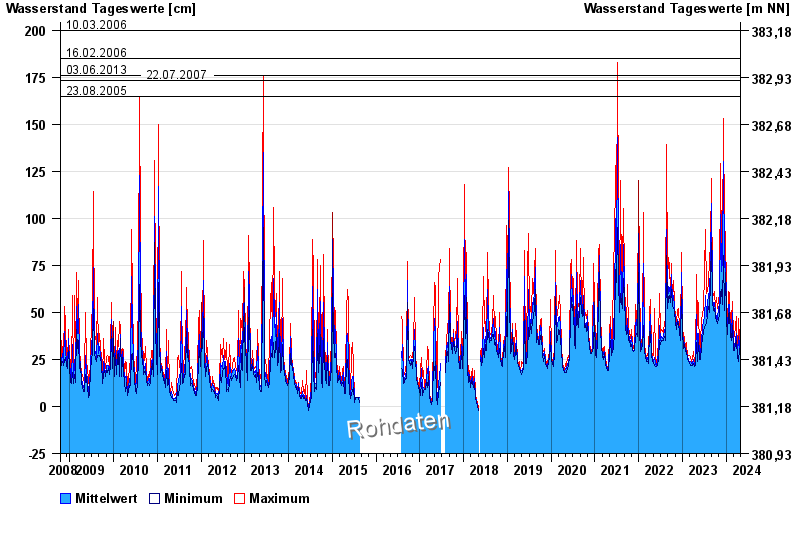
- 10.03.2006 Wasserstand: 200 cm
- 16.02.2006 Wasserstand: 185 cm
- 03.06.2013 Wasserstand: 176 cm
- 22.07.2007 Wasserstand: 173 cm
- 23.08.2005 Wasserstand: 165 cm
| Date | Mean value [cm] | Maximum [cm] | Minimum [cm] |
|---|---|---|---|
| 29.04.2024 | 24 | 24 | 24 |
| 28.04.2024 | 25 | 25 | 24 |
| 27.04.2024 | 26 | 26 | 25 |
| 26.04.2024 | 27 | 29 | 26 |
| 25.04.2024 | 28 | 28 | 27 |
| 24.04.2024 | 29 | 29 | 28 |
| 23.04.2024 | 30 | 31 | 29 |
© Bayerisches Landesamt für Umwelt 2024