
- Start >
- Rivers >
- Waterlevel >
- Bayern >
- Goldbergsee Ablauf >
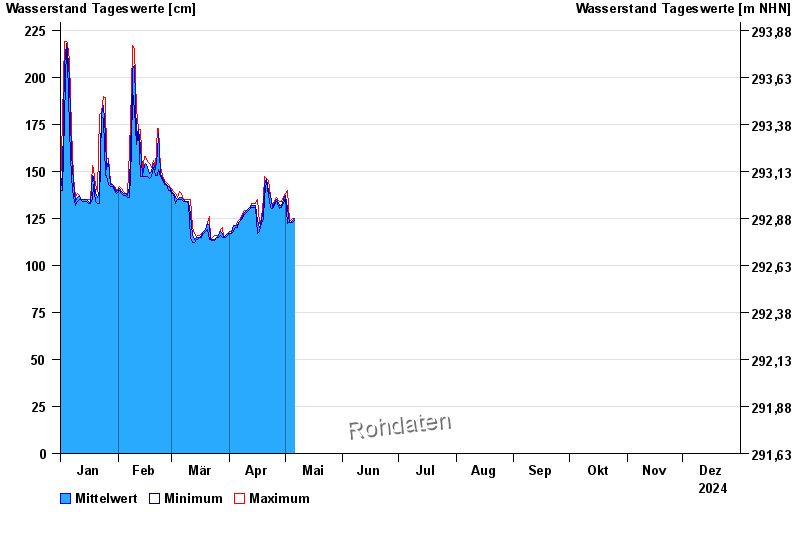
- Chart of year

Chart of year Goldbergsee Ablauf / Sulzbach
Waterlevel from 01.01.2024 to 31.12.2024
note
Aktuell Rückstau durch Biberdamm. Dadurch ist die Umrechnung des Wasserstand auf den Abfluss beeinflusst.
- 24.12.2012 Wasserstand: 257 cm
- 28.02.2009 Wasserstand: 252 cm
- 17.12.2012 Wasserstand: 246 cm
- 09.01.2011 Wasserstand: 241 cm
- 26.02.2010 Wasserstand: 240 cm
| Date | Mean value [cm] | Maximum [cm] | Minimum [cm] |
|---|---|---|---|
| 31.12.2024 | 127 | 127 | 127 |
| 30.12.2024 | 128 | 128 | 127 |
| 29.12.2024 | 129 | 131 | 127 |
| 28.12.2024 | 130 | 131 | 130 |
| 27.12.2024 | 131 | 131 | 130 |
| 26.12.2024 | 132 | 135 | 129 |
| 25.12.2024 | 136 | 139 | 135 |
© Bayerisches Landesamt für Umwelt 2025