
- Start >
- Rivers >
- Waterlevel >
- Bayern >
- Goldbach >
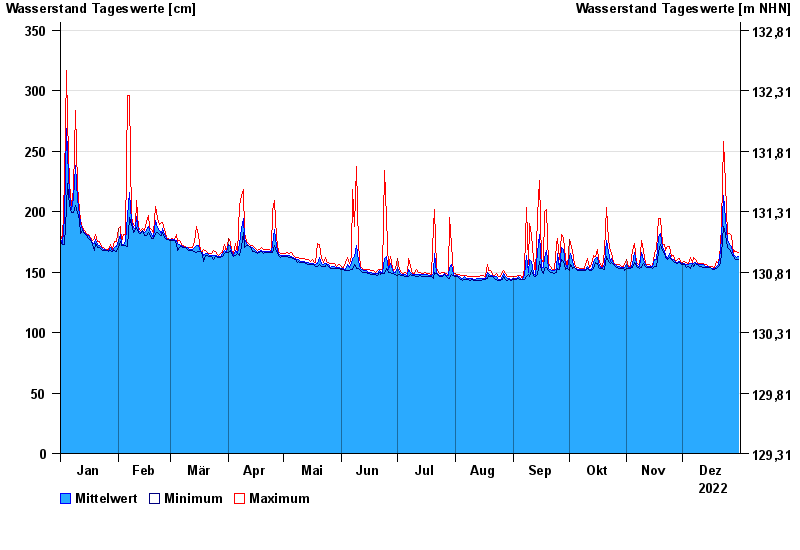
- Chart of year

Chart of year Goldbach / Aschaff
Waterlevel from 01.01.2022 to 31.12.2022
- 10.08.1981 Wasserstand: 462 cm
- 28.10.1998 Wasserstand: 426 cm
- 26.01.1995 Wasserstand: 407 cm
- 14.07.1980 Wasserstand: 392 cm
- 11.07.1980 Wasserstand: 389 cm
| Date | Mean value [cm] | Maximum [cm] | Minimum [cm] |
|---|---|---|---|
| 31.12.2022 | 163 | 166 | 160 |
| 30.12.2022 | 162 | 167 | 160 |
| 29.12.2022 | 164 | 168 | 161 |
| 28.12.2022 | 164 | 165 | 163 |
| 27.12.2022 | 171 | 180 | 165 |
| 26.12.2022 | 173 | 182 | 169 |
| 25.12.2022 | 176 | 181 | 170 |
© Bayerisches Landesamt für Umwelt 2024