
- Start >
- Rivers >
- Waterlevel >
- Bayern >
- Görisried >
- Chart of month

Chart of month Görisried / Waldbach
Waterlevel from 01.07.2024 to 31.07.2024
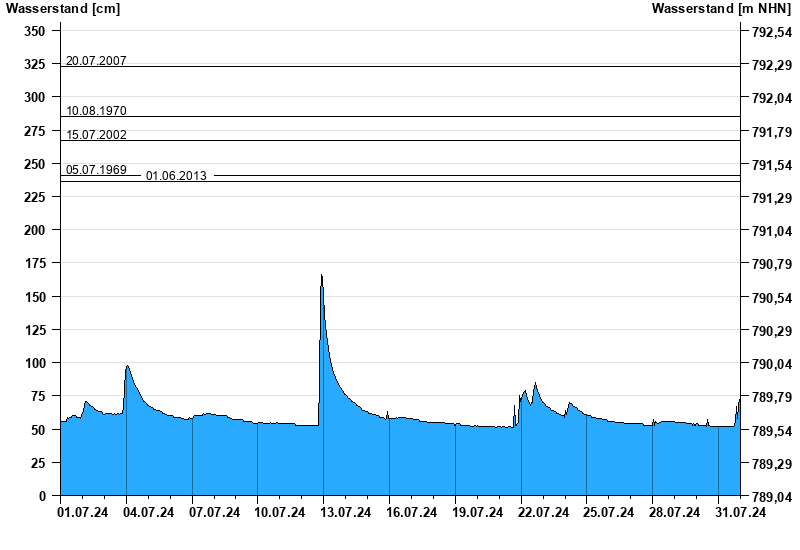
- 20.07.2007 Wasserstand: 323 cm
- 10.08.1970 Wasserstand: 285 cm
- 15.07.2002 Wasserstand: 267 cm
- 05.07.1969 Wasserstand: 241 cm
- 01.06.2013 Wasserstand: 236 cm
| Date | Waterlevel [cm] |
|---|---|
| 01.08.2024 00:45 | 76 |
| 01.08.2024 00:30 | 76 |
| 01.08.2024 00:15 | 75 |
| 01.08.2024 00:00 | 73 |
| 31.07.2024 23:45 | 73 |
| 31.07.2024 23:30 | 73 |
| 31.07.2024 23:15 | 72 |
© Bayerisches Landesamt für Umwelt 2025