
- Start >
- Rivers >
- Waterlevel >
- Bayern >
- Fritz am Sand >
- Chart of total period

Chart of total period Fritz am Sand / Weiße Traun
Waterlevel from 01.11.1969 to 26.04.2024
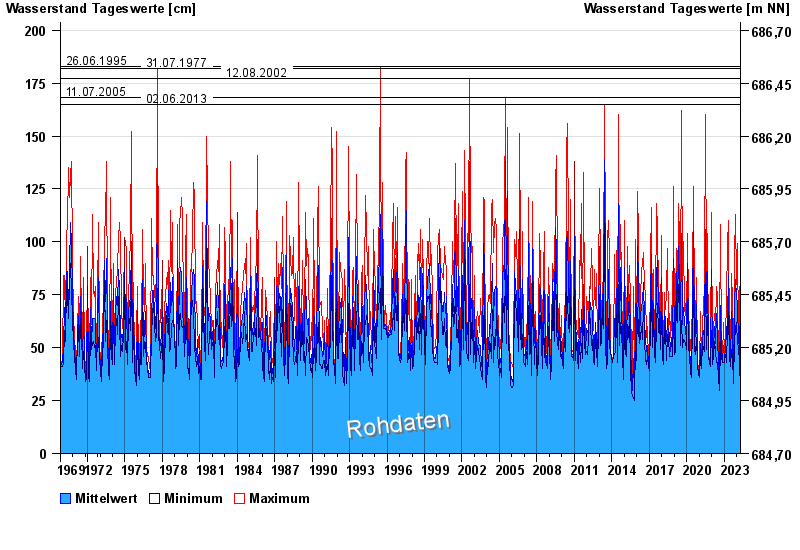
- 26.06.1995 Wasserstand: 183 cm
- 31.07.1977 Wasserstand: 182 cm
- 12.08.2002 Wasserstand: 177 cm
- 11.07.2005 Wasserstand: 168 cm
- 02.06.2013 Wasserstand: 165 cm
| Date | Mean value [cm] | Maximum [cm] | Minimum [cm] |
|---|---|---|---|
| 26.04.2024 | 30 | 30 | 30 |
| 25.04.2024 | 30 | 31 | 28 |
| 24.04.2024 | 30 | 31 | 28 |
| 23.04.2024 | 30 | 30 | 30 |
| 22.04.2024 | 30 | 31 | 29 |
| 21.04.2024 | 31 | 31 | 30 |
| 20.04.2024 | 32 | 35 | 30 |
© Bayerisches Landesamt für Umwelt 2024