
- Start >
- Rivers >
- Waterlevel >
- Bayern >
- Fischen >
- Chart of total period

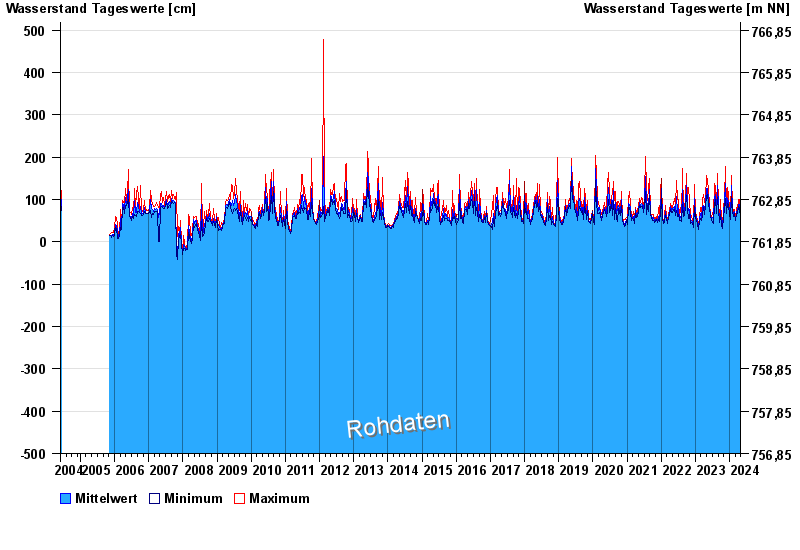
Chart of total period Fischen / Iller
Waterlevel from 02.06.2004 to 26.04.2024
 Für diesen Pegel sind keine Hochwassermarken hinterlegt.
| Date | Mean value [cm] | Maximum [cm] | Minimum [cm] |
|---|---|---|---|
| 26.04.2024 | 55 | 56 | 53 |
| 25.04.2024 | 54 | 56 | 53 |
| 24.04.2024 | 55 | 56 | 53 |
| 23.04.2024 | 56 | 57 | 54 |
| 22.04.2024 | 58 | 59 | 56 |
| 21.04.2024 | 60 | 62 | 58 |
| 20.04.2024 | 63 | 65 | 61 |
© Bayerisches Landesamt für Umwelt 2024