
- Start >
- Rivers >
- Waterlevel >
- Bayern >
- Feldolling >
- Chart of year

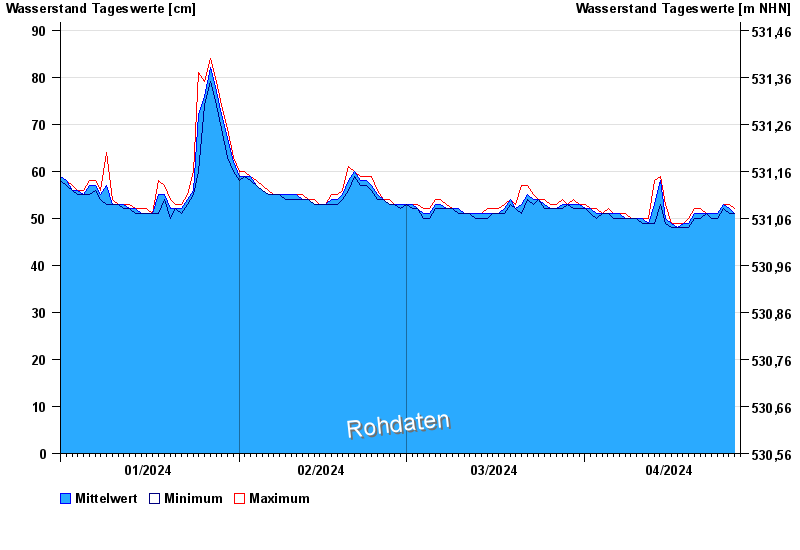
Chart of year Feldolling / Mangfall
Waterlevel from 01.01.2024 to 27.04.2024
- 02.06.2013 Wasserstand: 325 cm
- 21.05.1999 Wasserstand: 296 cm
- 23.08.2005 Wasserstand: 289 cm
- 03.06.2010 Wasserstand: 287 cm
- 04.08.2020 Wasserstand: 284 cm
| Date | Mean value [cm] | Maximum [cm] | Minimum [cm] |
|---|---|---|---|
| 27.04.2024 | 50 | 51 | 49 |
| 26.04.2024 | 50 | 52 | 50 |
| 25.04.2024 | 51 | 51 | 50 |
| 24.04.2024 | 51 | 51 | 50 |
| 23.04.2024 | 51 | 51 | 50 |
| 22.04.2024 | 51 | 51 | 51 |
| 21.04.2024 | 51 | 52 | 50 |
© Bayerisches Landesamt für Umwelt 2024