
- Start >
- Rivers >
- Waterlevel >
- Bayern >
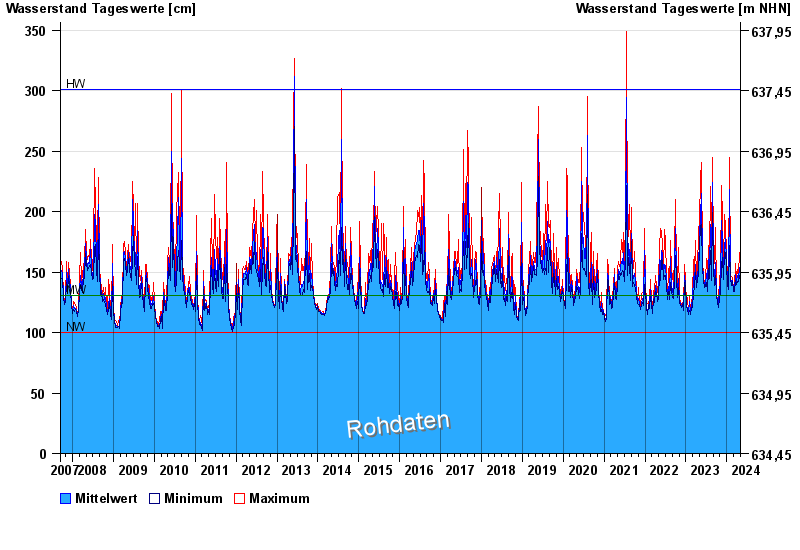
- Eschenlohe Brücke >
- Chart of total period

Chart of total period Eschenlohe Brücke / Loisach
Waterlevel from 15.09.2007 to 02.05.2024
note
Messwerte beeinflusst durch Kraftwerkssteuerungen.
| Date | Mean value [cm] | Maximum [cm] | Minimum [cm] |
|---|---|---|---|
| 02.05.2024 | 152 | 152 | 152 |
| 01.05.2024 | 150 | 154 | 147 |
| 30.04.2024 | 154 | 159 | 149 |
| 29.04.2024 | 155 | 162 | 148 |
| 28.04.2024 | 153 | 166 | 146 |
| 27.04.2024 | 145 | 156 | 139 |
| 26.04.2024 | 139 | 144 | 136 |
© Bayerisches Landesamt für Umwelt 2024