
- Start >
- Rivers >
- Waterlevel >
- Bayern >
- Eching >
- Chart of year

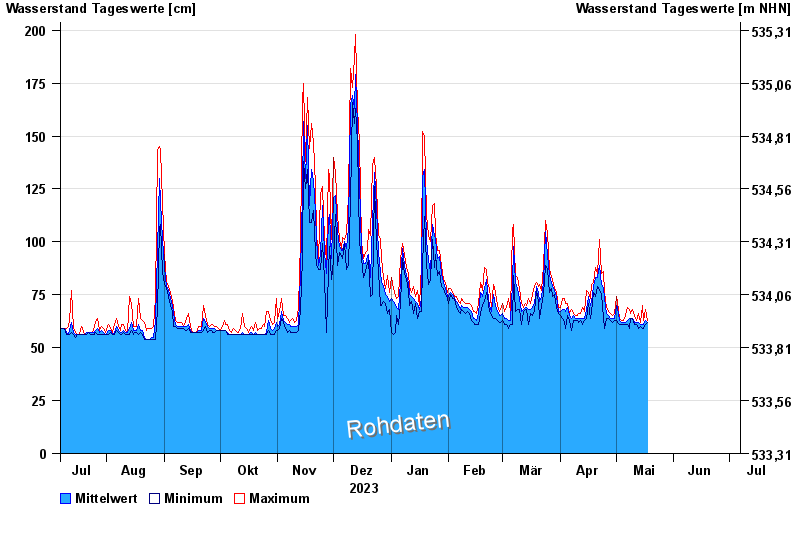
Chart of year Eching / Windach
Waterlevel from 07.07.2023 to 06.07.2024
note
Pegel beeinflusst durch Kraftwerkssteuerung
| Date | Mean value [cm] | Maximum [cm] | Minimum [cm] |
|---|---|---|---|
| 05.05.2024 | 62 | 62 | 62 |
| 04.05.2024 | 62 | 63 | 61 |
| 03.05.2024 | 63 | 64 | 61 |
| 02.05.2024 | 69 | 72 | 62 |
| 01.05.2024 | 70 | 74 | 63 |
| 30.04.2024 | 64 | 66 | 63 |
| 29.04.2024 | 64 | 65 | 62 |
© Bayerisches Landesamt für Umwelt 2024