
- Start >
- Rivers >
- Waterlevel >
- Bayern >
- Eching >
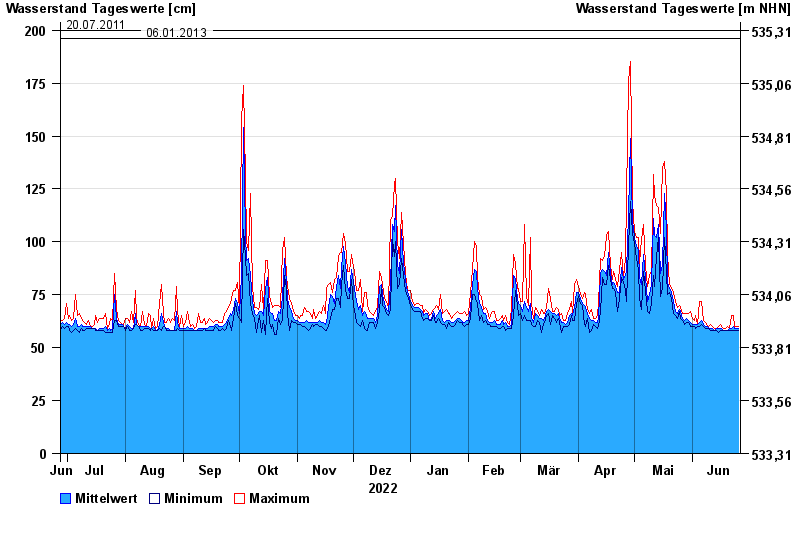
- Chart of year

Chart of year Eching / Windach
Waterlevel from 27.06.2022 to 26.06.2023
note
Pegel beeinflusst durch Kraftwerkssteuerung
- 02.06.2013 Wasserstand: 264 cm
- 22.05.2019 Wasserstand: 216 cm
- 04.01.2015 Wasserstand: 207 cm
- 20.07.2011 Wasserstand: 200 cm
- 06.01.2013 Wasserstand: 196 cm
| Date | Mean value [cm] | Maximum [cm] | Minimum [cm] |
|---|---|---|---|
| 26.06.2023 | 59 | 60 | 58 |
| 25.06.2023 | 59 | 60 | 58 |
| 24.06.2023 | 59 | 60 | 58 |
| 23.06.2023 | 60 | 65 | 58 |
| 22.06.2023 | 59 | 65 | 58 |
| 21.06.2023 | 59 | 59 | 58 |
| 20.06.2023 | 58 | 60 | 58 |
© Bayerisches Landesamt für Umwelt 2024